A report with one column per month is easy to read but hard to sort, filter, or summarize. Power Query can turn those month columns into rows, so each value gets its own line with the month name next to it.
This guide uses a made-up table with one product per row and three month columns. We unpivot it, show the exact result, and point out what happened to the one empty cell.
Applies to: Microsoft documents unpivoting columns in Power Query for Excel for Microsoft 365, Excel 2024, and Excel 2021. Tested in the Excel desktop app with an English interface on Korean-language Windows. We did not test other Excel versions, so menu names may differ.
What the Data Looks Like
Our test sheet has a product column and one column each for Jan, Feb, and Mar. Three products, nine numbers, except that the Gadget cell under Feb is empty. All names and numbers are fictional.
One column per month. The Gadget cell under Feb is empty.
Step 1: Send the Table to Power Query
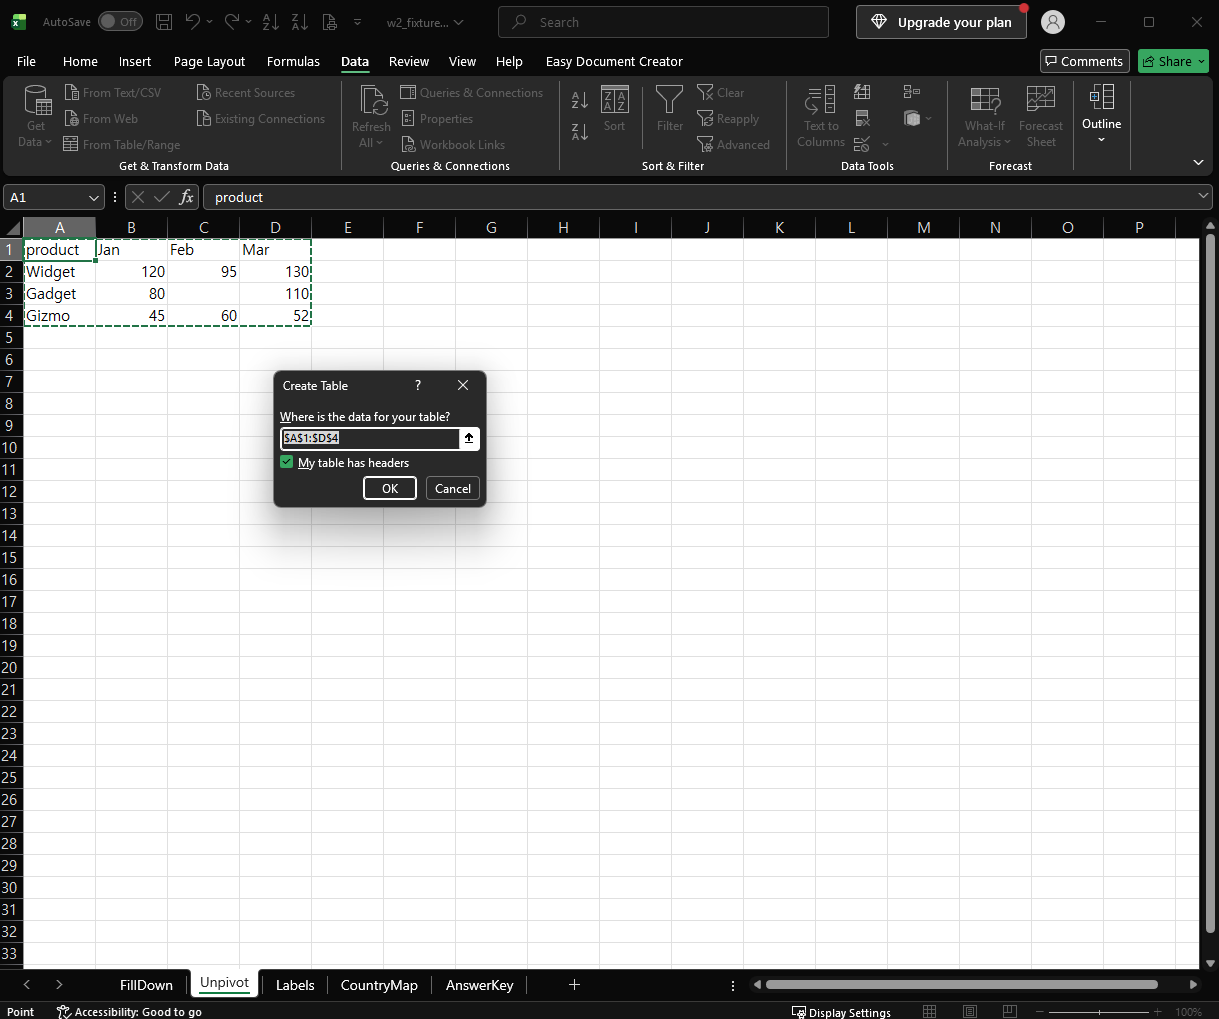
Click any cell in the data. On the Data tab, choose From Table/Range. Excel asks you to confirm the range and whether the table has headers.
Confirm the range and the header option, then click OK.
We confirmed A1:D4 with the header option checked. The Power Query Editor opens with the data and a Changed Type step. Excel named our query Table2, and yours may have another name.
Step 2: Unpivot the Other Columns
Click the product column header to select it. On the Transform tab, open the Unpivot Columns drop-down. It has three commands: Unpivot Columns, Unpivot Other Columns, and Unpivot Only Selected Columns.
Select product, then choose Unpivot Other Columns.
Choose Unpivot Other Columns. This keeps the column you selected and turns every other column into rows. Per Microsoft, it is the command to use when you do not know all the column names in advance.
The Result
The table now has three columns: product, Attribute (the old column names), and Value (the numbers). It has 8 rows. The step list shows Source, Changed Type, and Unpivoted Other Columns, and the step uses this formula:
The unpivoted table: 3 columns and 8 rows. There is no row for Gadget in Feb.
We started with nine value cells and got eight rows. The empty Gadget / Feb cell did not become a row. In the preview the empty cell had shown as null, and the unpivoted result has no line for it. Check this if you count rows or total the values afterward.
If you need a row for the empty cell, replace the null with a value before you unpivot. We did not test that.
What We Did Not Test
Loading the result back to a worksheet with Close & Load.
Adding a new month column and refreshing. Microsoft says new columns are also unpivoted when you use Unpivot Other Columns. We did not verify that ourselves.
Tables with more than one ID column, text values in the month columns, or other Excel versions.
Use Data > From Table/Range, select the ID column, choose Transform > Unpivot Columns > Unpivot Other Columns, and check the row count, because empty cells do not become rows.
Sources
Unpivot columns (Power Query) — Microsoft Support. Backs the Transform tab commands, what each of the three commands does, the statement that Unpivot Other Columns suits unknown column names, the statement that new columns added during a refresh are also unpivoted, and the Applies-to list (Microsoft 365, 2024, 2021).
Note: the 8-row result, the missing Gadget / Feb row, the Table.UnpivotOtherColumns formula, and the Create Table step come from our own reproduction in the Excel desktop app, not from this page.
Many report exports print a group label once and leave the cells below it empty. Sorting, filtering, or a PivotTable then treats those empty cells as missing data. You can fill each blank with the value above it in a few steps, without copying anything by hand.
This guide uses a small made-up sales list, selects only the blank cells, and fills them with one formula. We also point out what we did not test.
Applies to: Microsoft documents Go To Special and its Blanks option for Excel for Microsoft 365, Excel 2024, and Excel 2021. Tested in the Excel desktop app with an English interface on Korean-language Windows. We did not test other Excel versions, so menu names may differ.
What the Export Looks Like
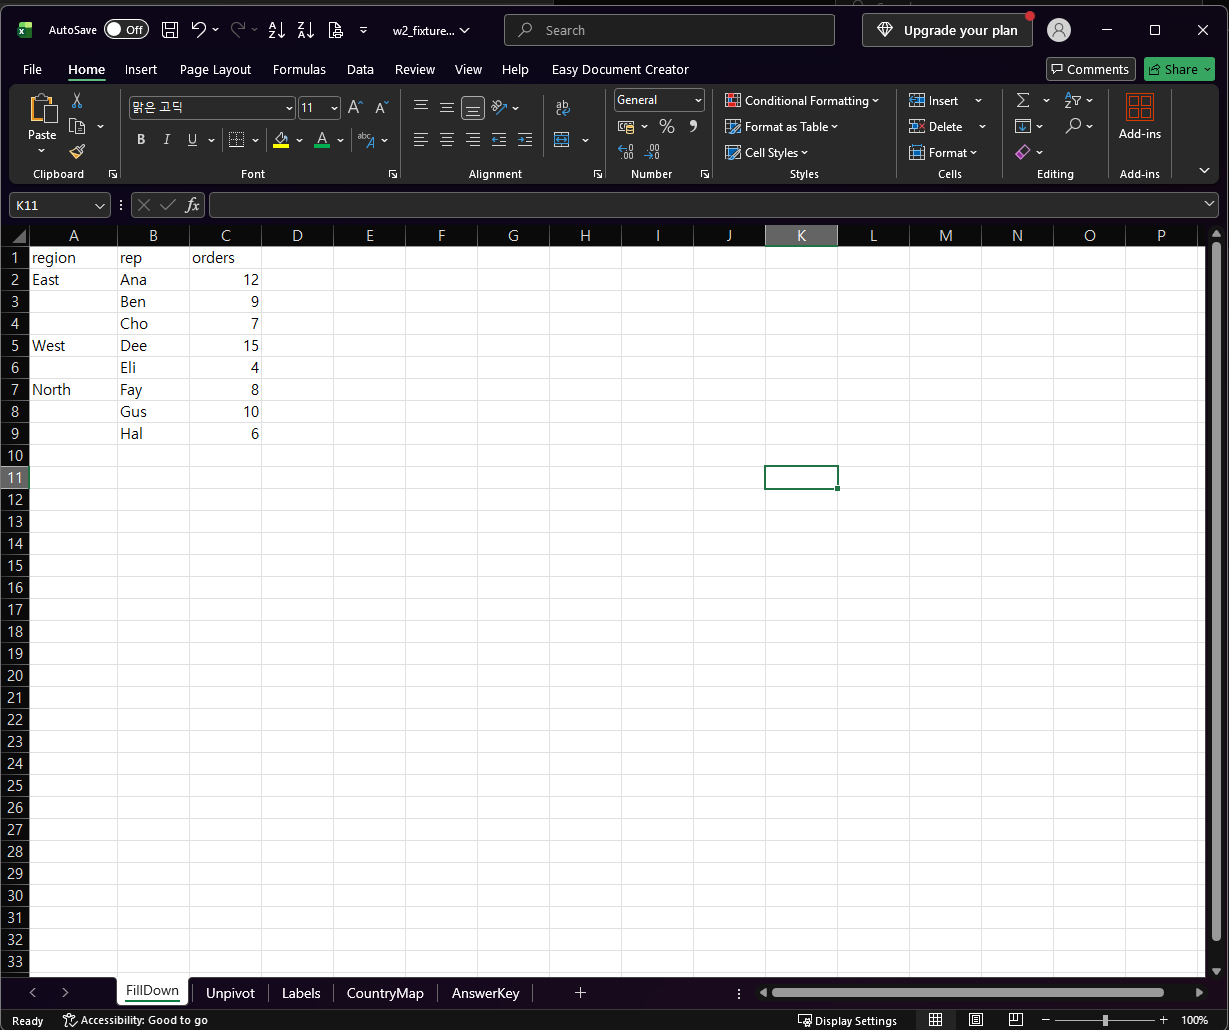
Our test sheet has three columns: region, rep, and orders. The region is filled only on the first row of each group (East in row 2, West in row 5, and North in row 7). The cells below each one are empty. All names and numbers are fictional.
The region is printed once per group. The cells below it are empty.
Step 1: Select Only the Blank Cells
Select the cells of the region column that hold the data. Then open the Go To dialog (Home > Find & Select > Go To, or press Ctrl+G), click Special, choose Blanks, and click OK.
Excel now has only the empty cells selected. The cells that already hold a region are not part of the selection.
Step 2: Type the Formula and Fill All Blanks at Once
Do not click anywhere yet. The first selected blank cell is the active cell. Type a formula that points to the cell directly above it. In our sheet the first blank cell was A3, so we typed this:
=A2
Then press Ctrl+Enter instead of Enter. Excel enters the formula in every selected cell, and each one points to the cell above it.
Only the blank cells are selected, and =A2 is being typed in the first one.
The Result
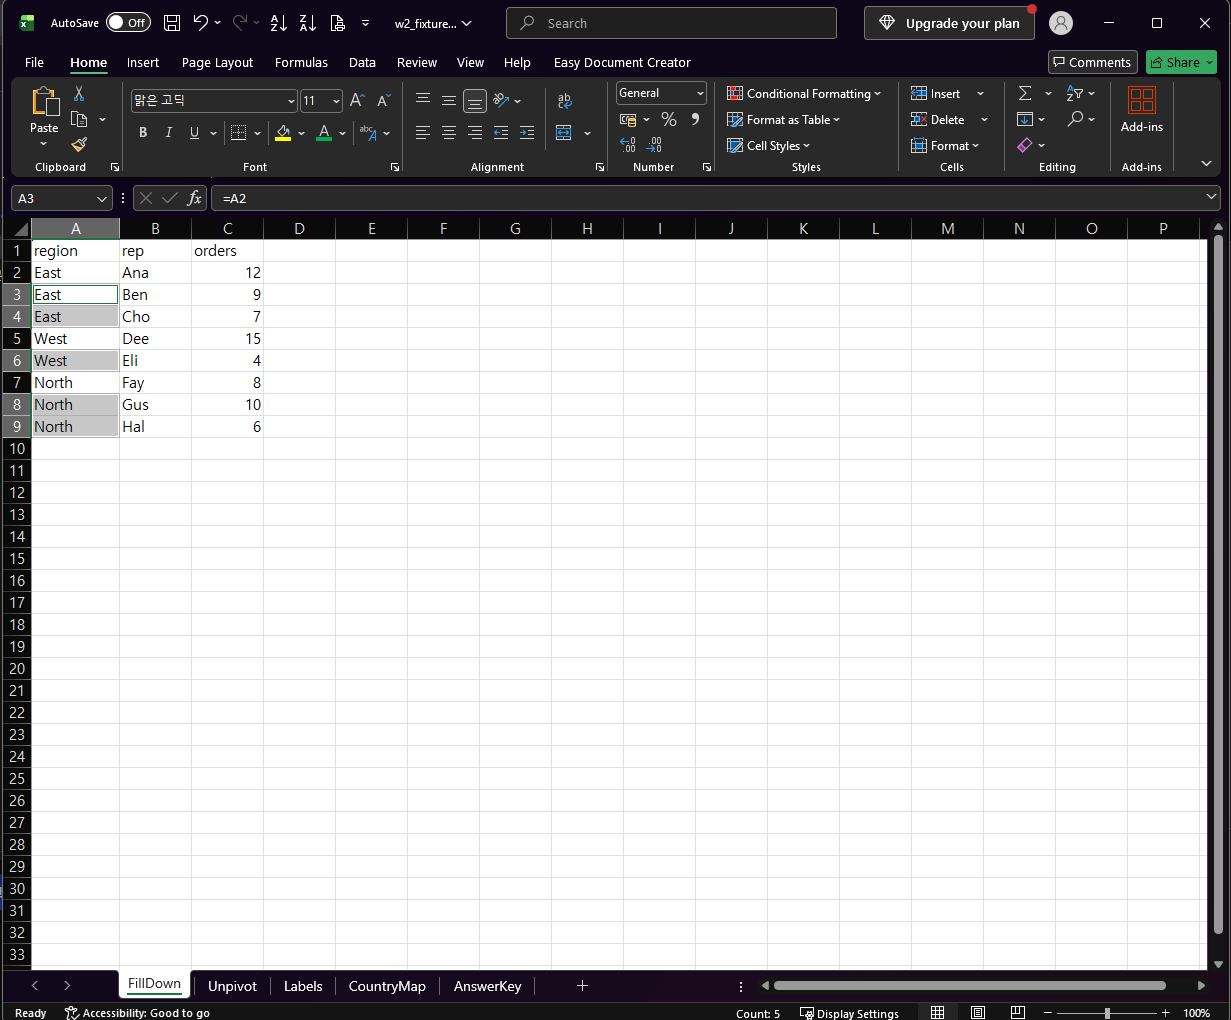
Every blank now shows the value above it: East three times, West twice, and North three times. Cell A3 holds =A2, as the formula bar shows. The status bar counted 5 filled cells, which matches the five blanks we started with.
After Ctrl+Enter, every blank repeats the value above it.
Check These Before You Rely on It
The cells are formulas, not values. We did not test converting them to values, so check that before you sort or copy the column somewhere else.
The formula copies whatever is above. If a blank cell is a real gap and not the continuation of a group, it will be filled too. Scan your data first.
We tested a single column. We did not try several columns at once, a filtered list, or a Power Query Fill Down step.
One-line Summary
Select the column, use Go To > Special > Blanks, type =A2 (a reference to the cell above the first blank), and press Ctrl+Enter.
Sources
Find and select cells that meet specific conditions — Microsoft Support. Backs the Home > Find & Select > Go To > Special path, the Blanks option (“Blank cells”), the Ctrl+G shortcut, and the Applies-to list (Microsoft 365, 2024, 2021).
Note: the =A2 formula, the Ctrl+Enter fill, the East/West/North result, and the Count: 5 status bar come from our own reproduction in the Excel desktop app, not from this page.
You get one CSV per month and you need them in one table. Copy and paste works once, and then next month you do it again. Power Query can read every file in a folder and stack them into one table that you refresh when a new file arrives.
This guide shows the whole path with four small test files, one of which has a different column order and one of which has a changed header and a blank line. The combined result was not what we first expected, so you will also see what went wrong, how we fixed it, and how a new file showed up after a refresh.
Applies to: Microsoft documents importing a folder of files with Power Query for Excel for Microsoft 365, Excel 2024, Excel 2021, Excel 2019, and Excel 2016. Tested in the Excel desktop app with an English interface on Korean-language Windows. We tested CSV files only and did not test other Excel versions, so menu names may differ.
The files are made up: sales_2026-01.csv to sales_2026-04.csv, each with order_id, region, product, qty, and unit_price. The February file lists the same columns in a different order. The March file calls the first column Order ID and has a blank line after its first row. All values are fictional.
Step 1: Put the Files in One Folder
Put the CSV files in a folder by themselves. Microsoft says every file in the folder and its subfolders is included, and that the files should have matching column headers, data types, and column count. Column order can differ, because Power Query matches columns by name.
Do not save your workbook in that folder. Any other file in the folder would be listed too.
Step 2: Point Excel at the Folder
On the Data tab, choose Get Data > From File > From Folder, and select the folder. Excel lists the files it found.
The folder dialog lists the four CSV files. Choose Combine to merge them.
We saw four files and three buttons: Combine, Load, and Transform Data. Transform Data only opens the list of files. It does not merge them. To merge, use Combine.
Step 3: Combine
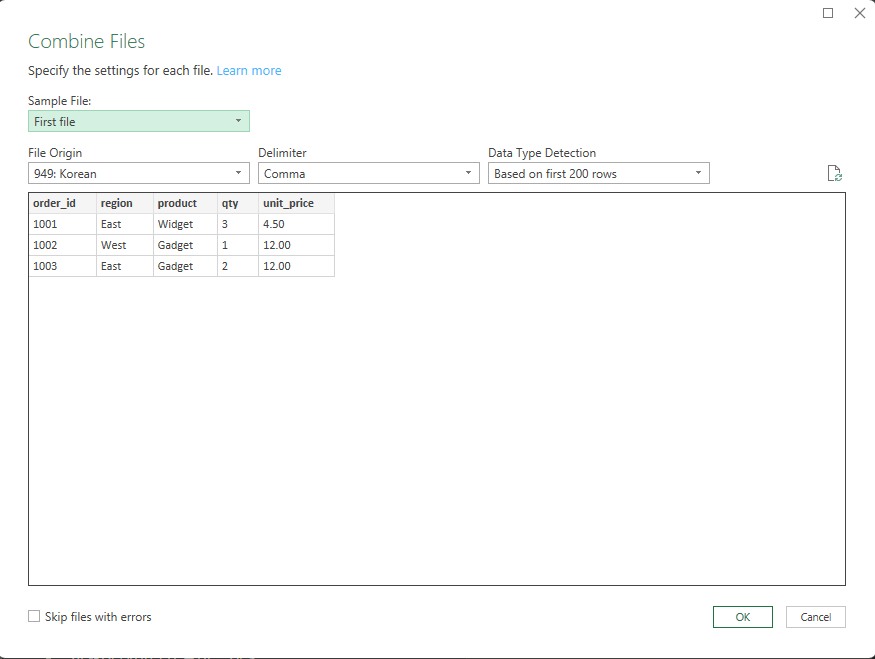
Click Combine and then Combine & Transform Data. The Combine Files dialog asks which file to use as the sample and how to read it.
The Combine Files dialog. We left every setting as it was.
On our computer the dialog showed First file as the sample, Comma as the delimiter, and Based on first 200 rows for data type detection. File Origin was set to 949: Korean, which matches our Korean-language Windows. We did not change any setting. If your files use another encoding, check this box.
Click OK. The Power Query Editor opens with the combined table.
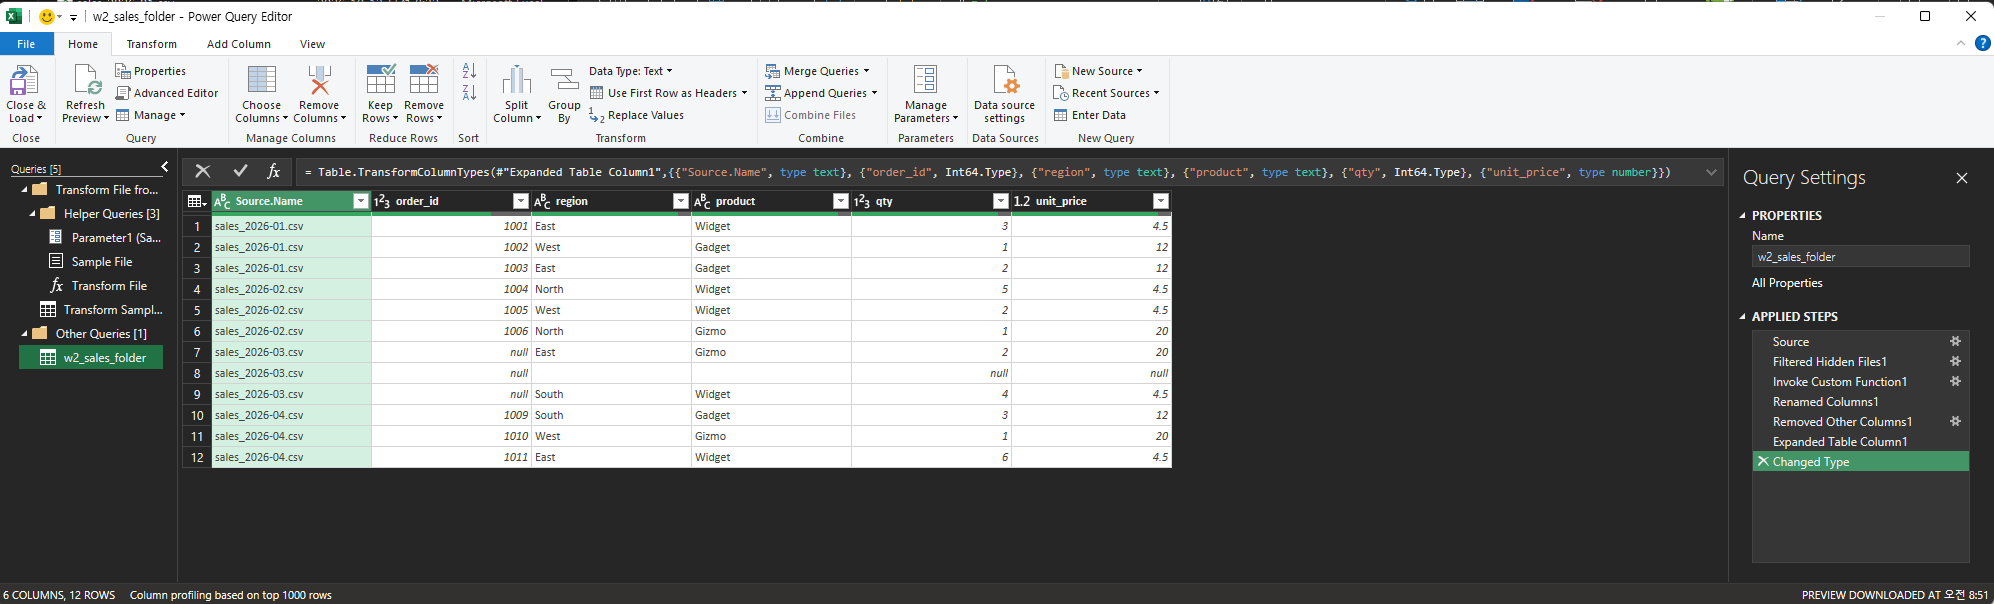
The first combined result: 6 columns and 12 rows.
The result had 6 columns and 12 rows. Power Query added a Source.Name column that shows which file each row came from. On the left it created helper queries (Sample File, Parameter1, Transform File, and Transform Sample File), and the main query ended with these steps: Source, Filtered Hidden Files1, Invoke Custom Function1, Renamed Columns1, Removed Other Columns1, Expanded Table Column1, and Changed Type.
The formula bar shows that the automatic Changed Type step set order_id and qty to whole numbers (Int64.Type). If your IDs have leading zeros, that step will remove them. See our guide to keeping leading zeros before you load.
What We Did Not Expect: A Silent Null and a Blank Row
Our test data had 11 orders, so we expected 11 rows. We got 12, and two of the rows were wrong.
February rows are correct. March rows have no order_id, and the blank line became a row.
Different column order worked. The February rows (1004 to 1006) lined up correctly even though the columns were in another order in the file. That matches Microsoft’s statement that columns are matched by name.
A changed header did not work, and there was no error. We expected an extra Order ID column. Instead there was no such column, and the March rows (1007 and 1008) had null in order_id while the other values came through. Our guess is that the Removed Other Columns1 step keeps only the columns found in the sample file. We did not verify that, so check your own result row by row.
The blank line became a row. The blank line in the March file turned into one row where only Source.Name had a value and everything else was null.
The lesson is that a single mismatched header does not stop the combine. The data can come through with a column silently empty. After you combine, look at the rows from each file, not only the first one.
Fix It in the File-Level Query, Not the Combined One
Because every file is processed by the same helper query, we fixed the problems there. In the left pane we opened Transform Sample File and added two steps.
First, a new step that renames the one header we knew was wrong. We selected the last step, clicked the fx button next to the formula bar, and replaced the text with this formula (the step before it was named Promoted Headers):
= Table.TransformColumnNames(#"Promoted Headers", each if _ = "Order ID" then "order_id" else _)
Then, on the Home tab, we chose Remove Rows > Remove Blank Rows.
The fix lives in Transform Sample File: a rename step (Custom1) and Removed Blank Rows.
This renames only the header Order ID and leaves every other name alone, so the files that already use order_id are not affected. It also means the fix only covers this one known difference. A different mismatch needs its own rule.
We did the blank-row cleanup in this file-level query on purpose. After the combine, the blank row has a file name in Source.Name, so it is no longer a completely empty row. We did not test Remove Blank Rows on the combined query.
Back on the main query, the preview now had 6 columns and 11 rows, with order_id filled from 1001 to 1011.
After the fix: 11 rows, and every row has an order_id.
Load It Into Excel
On the Home tab, click Close & Load. The table appears on a new sheet. Open Data > Queries & Connections to see how many rows were loaded.
The loaded table. The Queries & Connections pane reports 11 rows.
The pane showed 11 rows loaded. for our query.
Keep It Refreshable: Add a File and Refresh
This is what you do every month. We copied a fifth file, sales_2026-05.csv, into the same folder, then clicked Data > Refresh All. We did not open the query or change anything.
After Refresh All, the two rows from the new May file appear. The pane reports 13 rows.
The table grew by the two May rows (1012 and 1013), and the pane showed 13 rows loaded. Microsoft also says you can refresh the combined query to pick up new files, such as a new file each month.
If a new file arrives with a different header, the same silent-null problem from earlier can come back. Check the rows from the newest file after every refresh.
What We Did Not Test
Folders of Excel workbooks (.xlsx). We used CSV files only.
Files in subfolders. Microsoft says they are included. We did not try it.
Files with more or fewer columns than the sample file.
A sample file other than First file.
Other Excel versions, other regional settings, and other file encodings.
Saving the workbook and refreshing it later.
Which Version of Excel Do You Need?
Microsoft lists Excel for Microsoft 365, Excel 2024, Excel 2021, Excel 2019, and Excel 2016 for importing data from a folder with Power Query. We tested one desktop Excel build (English interface, Korean-language Windows), so button names may differ in other versions.
One-line Summary
Use Data > Get Data > From File > From Folder, choose Combine (not Transform Data), check the rows from every file for silent nulls and blank rows, fix the problems in the Transform Sample File query, load the result, and refresh when a new file is added to the folder. If you also import dates, see our guide to fixing dates after a CSV import.
Sources
Import data from a folder with multiple files (Power Query) — Microsoft Support. Backs the Data > Get Data > From File > From Folder path, the Combine and Combine & Transform Data options, the statement that all files in the folder and its subfolders are included, the requirement for matching headers, the statement that column order can differ because columns are matched by name, the refresh statement, and the Applies-to list.
Note: the 12-row first result, the null order_id values in the March rows, the blank line that became a row, the fix in Transform Sample File, the 11 rows loaded and 13 rows loaded messages, and the automatic Int64.Type on order_id and qty come from our own reproduction in the Excel desktop app, not from this page.
You import a CSV and the dates look wrong. Some are stuck as text and will not sort or calculate. Some show a five-digit number such as 46086. And some look fine but may have the day and month swapped, which is the worst case because nothing warns you.
This guide covers those three problems: text dates, serial numbers, and swapped day and month. For each one you will see how to recognize it, which formula or setting fixes it, and what we actually saw in Excel when we tried it. It also shows what Power Query does to dates automatically and how to control it.
Applies to: Microsoft documents the DATE function for Excel for Microsoft 365, Excel 2024, Excel 2021, Excel 2019, and Excel 2016. Tested in the Excel desktop app with an English interface on Korean-language Windows. How Excel reads a date typed as text can depend on your regional date settings. We did not change ours, so results may differ on your computer.
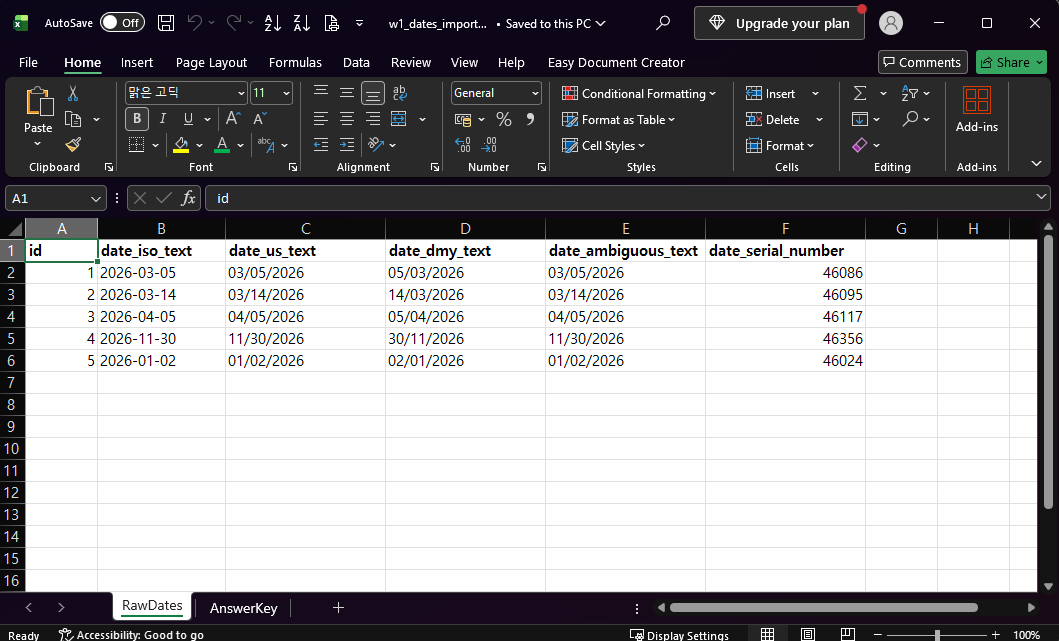
The screenshots use one made-up table of five dates. The same five dates appear in several formats: ISO text (2026-03-05), US text (03/05/2026), day-first text (05/03/2026), a second US-style column we call ambiguous, and a serial number (46086). All values are fictional.
Step 1: Find Out What Kind of Date You Have
Look at the alignment first. Numbers align to the right by default and text aligns to the left. In our test the four text columns are left-aligned and the serial number column is right-aligned.
Four date columns are text. The last column holds serial numbers.
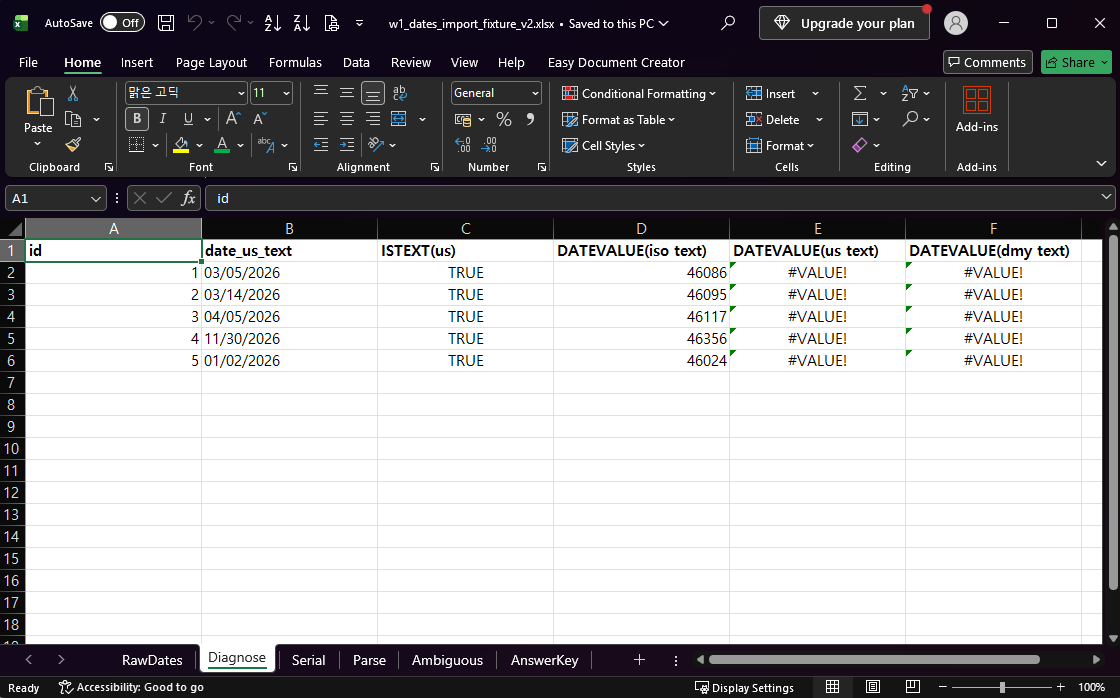
Alignment is only a hint, so confirm with ISTEXT. It returns TRUE for text and FALSE for a real number or date. Then try DATEVALUE, which converts a date written as text into a serial number:
=ISTEXT(B2)
=DATEVALUE(RawDates!B2)
DATEVALUE converted the ISO text, but returned #VALUE! for the other two text formats.
This is what we observed in our environment: ISTEXT was TRUE on all five rows. DATEVALUE converted the ISO text (2026-03-05 became 46086) but returned #VALUE! for both 03/05/2026 and 05/03/2026. Our Windows short date format was yyyy-MM-dd, which fits what we saw, but we did not change that setting to prove it is the cause. So do not assume DATEVALUE will read your format. Test it on a few rows before you rely on it.
Fix Dates Stored as Serial Numbers
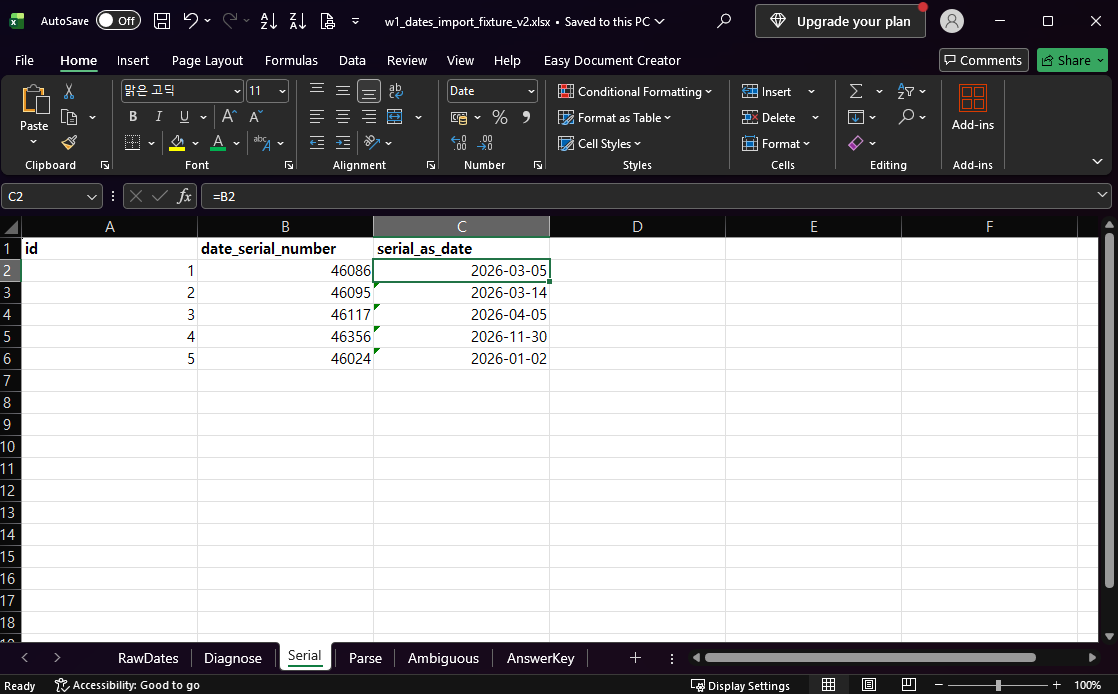
A value such as 46086 is a real number. Excel stores a date as a number and the cell format decides how it looks. To see the date, keep the number and apply a Date format to the cell:
Select the cells that hold the serial numbers.
On the Home tab, open the Number Format box and choose Date.
In our test the formula in the new column was just =B2 and the Date format did the rest.
The same serial numbers shown with the Date format.
The five serial numbers became 2026-03-05, 2026-03-14, 2026-04-05, 2026-11-30, and 2026-01-02, which matched our answer key. How the date is displayed (2026-03-05 here) can follow your computer’s regional settings, so yours may look different.
Fix Dates Stored as Text When You Know the Order
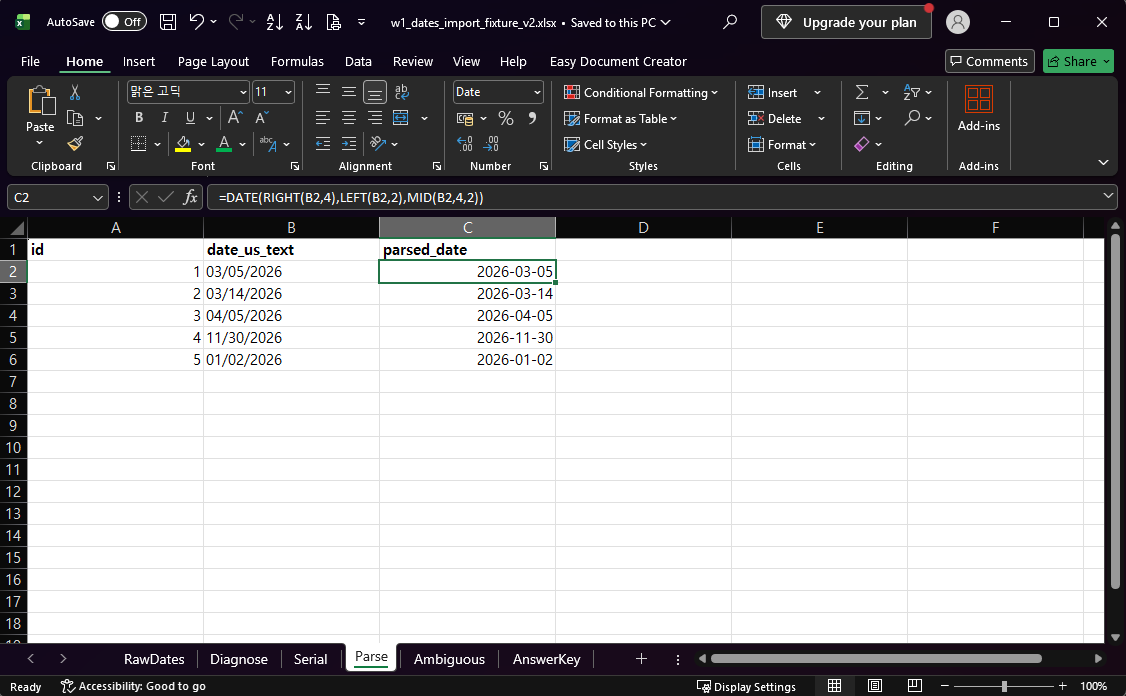
If DATEVALUE fails, you can build the date from its parts with DATE, RIGHT, LEFT, and MID. This works only if you know whether the text is month-first or day-first. For month-first text such as 03/05/2026, where the month is the first two characters:
=DATE(RIGHT(B2,4),LEFT(B2,2),MID(B2,4,2))
RIGHT(B2,4) is the year, LEFT(B2,2) is the month, and MID(B2,4,2) is the day. Format the result cell as Date.
DATE builds a real date from the year, month and day pieces of the text.
In our test all five rows came out correct, including 03/14/2026 (2026-03-14) and 11/30/2026 (2026-11-30). This formula assumes a two-digit month and a two-digit day with slashes, as in our file. We did not test text such as 3/5/2026, so check your own values first.
The Risky One: Day and Month Swapped
Some text dates cannot be read in only one way. 03/05/2026 could be March 5 or May 3. In our data the true date was March 5, but nothing in the text says so.
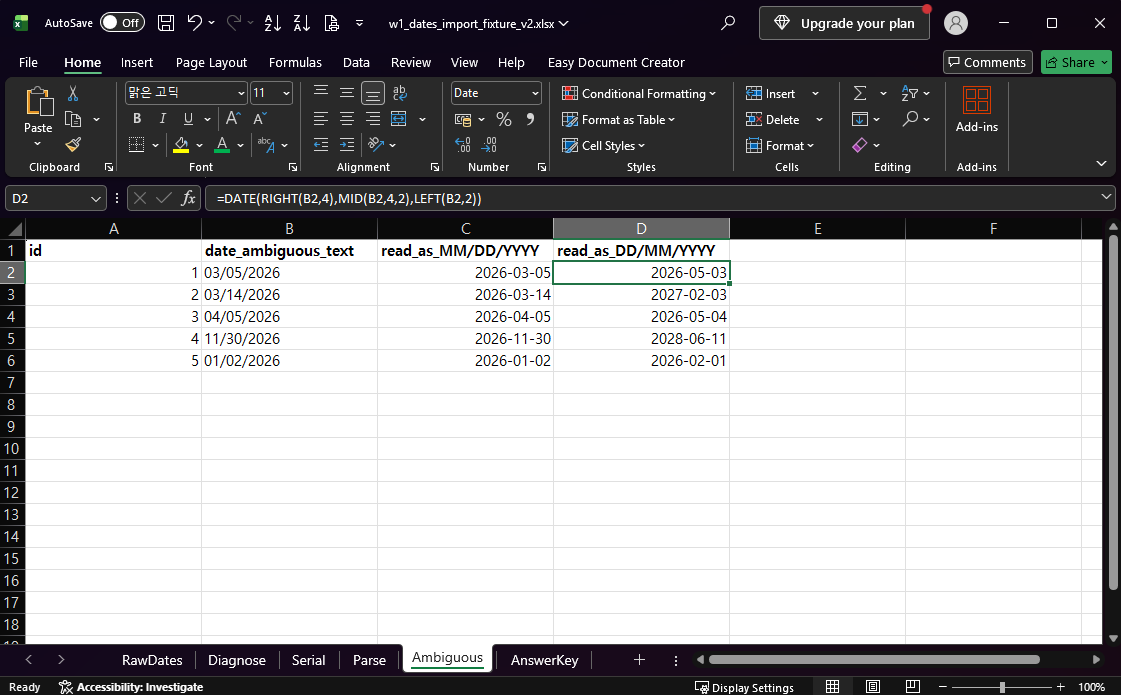
We compared two readings of the same column. The first reads the text as month-first. The second assumes day-first and uses the same functions with the pieces swapped:
The same text read two ways. Several rows give a different date, and none show an error.
Text
Read as month first
Read as day first (assumed)
03/05/2026
2026-03-05
2026-05-03
04/05/2026
2026-04-05
2026-05-04
01/02/2026
2026-01-02
2026-02-01
03/14/2026
2026-03-14
2027-02-03
11/30/2026
2026-11-30
2028-06-11
Two things stand out. When both numbers are 12 or less, both readings are valid dates and they differ, so you cannot tell which is right from the value alone. And when the second number is above 12, such as 03/14/2026, the day-first reading did not return an error. It returned 2027-02-03. Microsoft’s DATE page explains why: if the month is greater than 12, DATE adds that many months to the first month of the year you gave. So an assumed day-first formula on month-first text can quietly produce a wrong date in a later year.
These results come from our assumed day-first formula. They are not what Excel decided on its own. The practical rule: before you convert, scan the column for a value above 12 in the first or second position. A first number above 12 means day-first text. A second number above 12 means month-first text. If every row is 12 or less, ask whoever produced the file which order they used.
What Power Query Does to Dates Automatically
When you import with Data > From Text/CSV or From Table/Range and open the Power Query Editor, Excel adds a Changed Type step for you. In our test it turned both month-first columns into dates and left the day-first column as text.
The automatic Changed Type step read the month-first columns as dates.
The values in those two columns looked right (2026-03-05, 2026-03-14, and so on), but the step’s formula does not say which date format it assumed. That is why you should compare a few converted rows against the source, especially rows where both numbers are 12 or less.
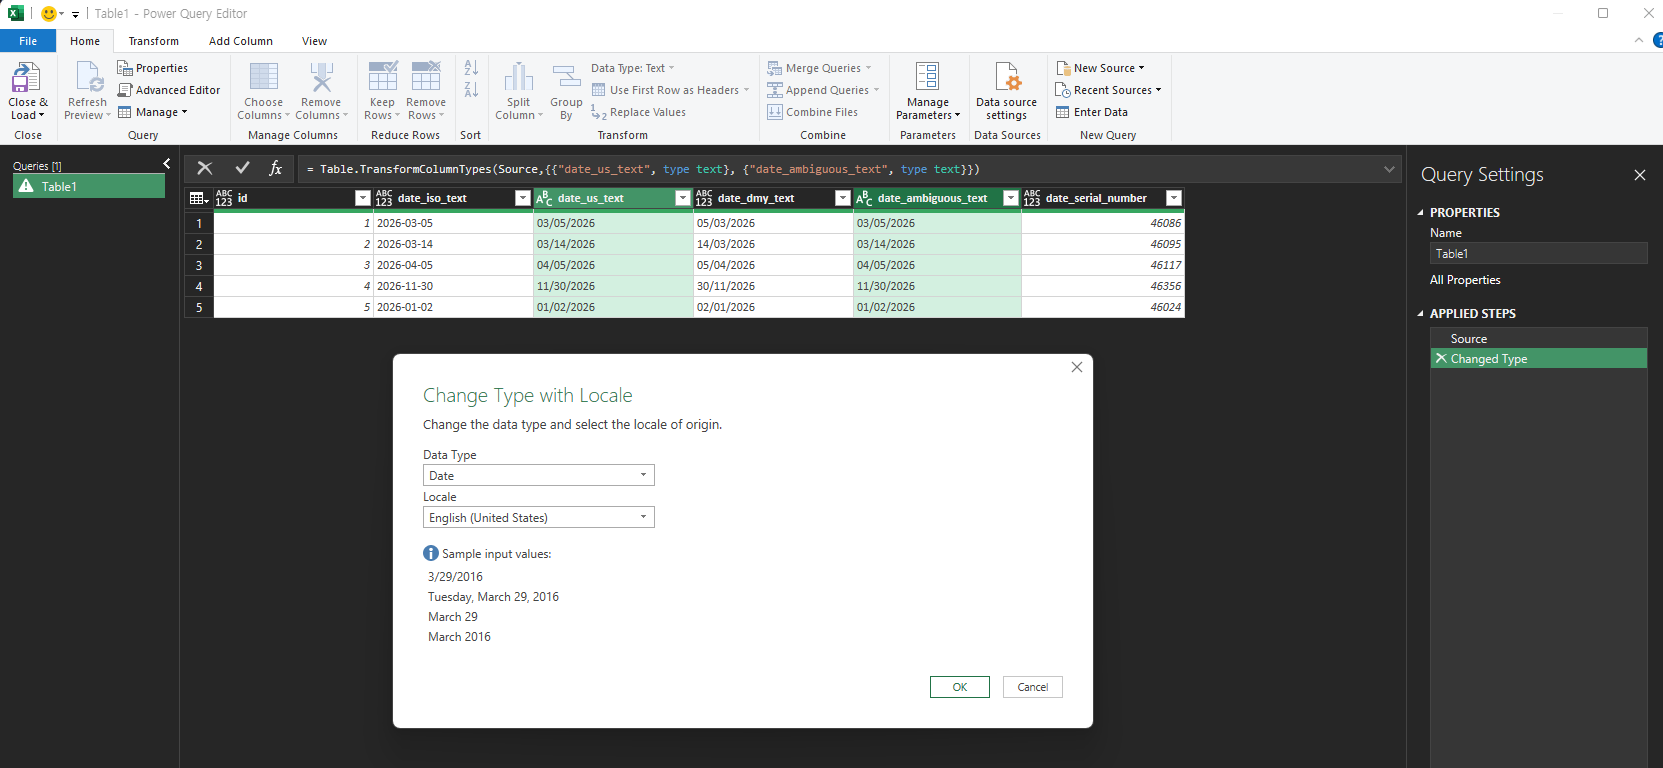
If you know the source uses month-first dates, you can set the type with a locale. In our test the Applied Steps list had a Changed Type step that set those two columns back to Text. We selected both columns and opened Change Type with Locale. We chose Date as the data type and English (United States) as the locale.
Change Type with Locale: Date as the type, English (United States) as the locale.
In our Excel build the Home tab’s Data Type list did not include a Using Locale item, so we reached the dialog another way. Menu names and locations can differ by version. If you cannot find it, look for a Change Type option that mentions a locale.
After Change Type with Locale, both month-first columns are dates and match the answer key.
The result matched our answer key on all five rows. The step’s formula now includes "en-US", so the locale is written down. This is only correct when the source really is month-first. We tested only the English (United States) locale, not other locales.
Which Fix to Use
What you see
Check
Fix
Our test
Five-digit number such as 46086
Right-aligned, ISTEXT is FALSE
Apply the Date format
Worked on 5 of 5 rows
Text date that DATEVALUE can read
ISTEXT is TRUE, DATEVALUE returns a number
DATEVALUE, then Date format
Worked for ISO text
Text date that DATEVALUE rejects
DATEVALUE returns #VALUE!
DATE with LEFT, MID, RIGHT in the right order
Worked on 5 of 5 rows (month-first)
Both numbers 12 or less
Look for rows above 12 or ask the source
Confirm the order first, then convert
Wrong order gave different dates
Dates imported through Power Query
Compare against the source
Change Type with Locale
Worked with en-US
Which Version of Excel Do You Need?
Microsoft lists Excel for Microsoft 365, Excel 2024, Excel 2021, Excel 2019, and Excel 2016 for the DATE function. We tested only one desktop Excel build (English interface, Korean-language Windows). Power Query menus and DATEVALUE results can differ in other versions and regional settings.
One-line Summary
Check whether your dates are text, serial numbers, or ambiguous, then fix each with the matching tool: the Date format for serial numbers, DATE with LEFT, MID, and RIGHT for text with a known order, and Change Type with Locale in Power Query. Never convert text like 03/05/2026 until you know whether the month or the day comes first.
DATE function — Microsoft Support. Backs the statement that a month greater than 12 adds that many months to the first month of the year, and the Applies-to list. It also shows how to build a date from text with DATE, LEFT, MID, and RIGHT.
Note: the ISTEXT and DATEVALUE results, the serial-number display, the month-first and day-first comparison, the automatic Changed Type step, and the Change Type with Locale result come from our own reproduction in the Excel desktop app, not from this page.
You type SKU-101 in one cell and the price list has SKU-101, yet VLOOKUP returns #N/A. The two values look identical, so the formula seems broken. It usually is not. In our test file, five of seven lookups returned #N/A. Four were caused by hidden differences between the two values, and one was correct because the value was not in the list. XLOOKUP failed on the same five rows.
This guide shows how to find which hidden difference you have, using three short helper formulas, and how to fix it by cleaning both sides before you match. It also shows the one case where #N/A is correct and nothing needs fixing.
Applies to: Microsoft documents VLOOKUP, TRIM, UNICHAR, and UNICODE for Excel for Microsoft 365, Excel 2024, Excel 2021, Excel 2019, and Excel 2016. Microsoft says XLOOKUP is not available in Excel 2016 and Excel 2019. Tested in the Excel desktop app with an English interface on Korean-language Windows. We did not test other Excel versions, so results may differ there.
The screenshots use a made-up order list (Orders sheet, 7 rows) and a made-up price list (PriceList sheet, 6 rows). All values are fictional.
What You See: #N/A on Values That Look the Same
The formula in column C is a normal exact-match lookup:
=VLOOKUP(B2,PriceList!$A$2:$B$7,2,FALSE)
Only SKU-100 and SKU-103 return a price. The other five rows return #N/A.
Only SKU-100 and SKU-103 returned a price. A-1002, A-1003, A-1005, A-1006, and A-1007 returned #N/A.
Microsoft’s VLOOKUP page says that FALSE means exact match and that #N/A means the exact value was not found in the first column. It also warns that leading or trailing spaces and nonprinting characters in the lookup data can cause unexpected results, and it advises against storing numbers as text. That matches what we found, but the page does not tell you which problem you have. For that you need to measure the cells.
Diagnose Before You Fix
Add three helper columns next to the lookup result:
LEN counts characters, the second formula returns the code of the last character, and ISNUMBER tells you whether the cell holds a number or text.
LEN, last character code, and ISNUMBER expose the hidden differences.
Here is how to read the results from our test:
Row
What you see
LEN
Last character code
ISNUMBER
What it means
A-1002
SKU-101
8
32
FALSE
The text is one character longer than it looks. Code 32 is a regular space at the end.
A-1003
SKU-102
8
160
FALSE
Also one character too long. Code 160 is a non-breaking space at the end.
A-1005
SKU-999
7
57
FALSE
Nothing hidden. The last character is the digit 9.
A-1006
2001
4
(blank)
TRUE
A real number. The price list stores 2001 as text.
A-1007
2002
4
50
FALSE
Text. The price list stores 2002 as a number.
In the first screenshot, 2001 is right-aligned and 2002 is left-aligned. Numbers align right by default and text aligns left, which is a quick visual hint, but the ISNUMBER column is the reliable check.
TRIM does not remove the code 160 character on its own, according to Microsoft. For why, and for a CHAR(160) pitfall on some systems, see our guide to why TRIM isn’t removing non-breaking spaces.
Fix: Clean Both Sides, Then Match
The idea is to build a clean version of the key on both sheets, with the same rules, and match on the clean versions. This formula goes in a helper column on Orders (column G, for the value in B2):
It turns numbers into text, replaces non-breaking spaces with regular spaces, and then trims the ends. Put the same formula in a helper column next to the price list (column C, for the value in A2), then look up the clean key:
After cleaning both sides, six rows find a price. SKU-999 still returns “not found”.
In our test, six of seven rows found their price. A-1002 returned 11.5, A-1003 returned 12.25, A-1006 returned 5, and A-1007 returned 6. A-1005 still returned “not found”, which is correct because SKU-999 is not in the price list.
Three notes on this fix:
We made both sides text. We did not test converting both sides to numbers instead.
UNICHAR(160) worked in our Excel environment. We did not test older versions, and Microsoft’s UNICHAR page lists Excel 2016 and later.
IFERROR returns “not found” for any error, so check that the clean columns look right before you trust the result.
It returned a price only for A-1001 (10) and A-1004 (9.99). The other five rows returned “not found”, the same five rows where VLOOKUP failed. Microsoft documents XLOOKUP exact match as its default, so the same hidden differences break it.
The same clean keys fix XLOOKUP. We pointed it at the two clean-key columns:
In our test it returned 10, 11.5, 12.25, 9.99, “not found”, 5, and 6 for the seven rows. That is the same result as the INDEX and MATCH version, including “not found” for SKU-999. We did not capture a screenshot of this extra check. If you use Excel 2016 or 2019, XLOOKUP is not available according to Microsoft, so the INDEX and MATCH fix is the one to use.
When #N/A Is Correct
Not every #N/A is a hidden character. A-1005 showed nothing unusual in the helper columns, and after cleaning it was still not found. When LEN matches what you see and ISNUMBER agrees on both sides, the value is probably missing from the list. In that case, fix the list, not the formula. To check which items from one list are missing from another, see our guide on comparing two lists in Excel.
If many of your numbers are stored as text and you need real numbers, see our guide on converting numbers stored as text in bulk. For lookup keys such as product codes with leading zeros or 16 or more digits, keep them as text instead.
Microsoft lists Excel for Microsoft 365, Excel 2024, Excel 2021, Excel 2019, and Excel 2016 for VLOOKUP, TRIM, UNICHAR, and UNICODE. Microsoft’s XLOOKUP page lists newer versions and states that XLOOKUP is not available in Excel 2016 and Excel 2019. We tested only one desktop Excel build (English interface, Korean-language Windows), so results and button names in other versions may differ.
One-line Summary
When VLOOKUP or XLOOKUP returns #N/A on values that look identical, compare LEN, the last character code, and ISNUMBER on both sides, then match on clean keys made with the same IF, TRIM, and SUBSTITUTE(…, UNICHAR(160), " ") formula. If a value is truly missing, fix the list.
Sources
VLOOKUP function — Microsoft Support. Backs the exact-match behavior of FALSE, #N/A when the exact value is not found, and the warning about spaces, nonprinting characters, and numbers stored as text.
XLOOKUP function — Microsoft Support. Backs the exact-match default, the if_not_found argument, and the statement that XLOOKUP is not available in Excel 2016 and Excel 2019.
TRIM function — Microsoft Support. Backs the statement that TRIM does not remove the non-breaking space (character 160) by itself.
Note: the #N/A results, the LEN, last-character-code, and ISNUMBER values, the clean-key results, and the XLOOKUP results come from our own reproduction in the Excel desktop app, not from these pages.
You open a CSV in Excel and a 16-digit tracking number turns into 1.23457E+15. A 12-digit reference number turns into 1.23457E+11. Both look like the same problem, but they are not. Excel only changed how the 12-digit number is displayed. For the 16-digit number, Excel also changed the stored value.
This guide explains how to stop Excel scientific notation on long numbers by importing the CSV with Data > From Text/CSV and setting those columns to Text before the data reaches the worksheet. It also shows why a number that has already lost digits cannot be repaired inside Excel, so the original file is what you need.
Applies to: Microsoft documents the 15-digit limit, the leading-zeros and large-number behavior, and the From Text/CSV import for Excel for Microsoft 365, Excel 2024, Excel 2021, Excel 2019, and Excel 2016. Tested in the Excel desktop app with an English interface on Korean-language Windows. We did not test other Excel versions, so menu names may look slightly different there.
The screenshots use a small made-up CSV with a 16-digit tracking_no column (1234567890123456, 9876543210987654, and so on) and a 12-digit ref_no column (123456789012, 987654321098, and so on).
What Goes Wrong When You Double-Click a CSV
When you open a .csv file directly, Excel applies its default format settings to each column. For long digit strings, that means they are read as numbers.
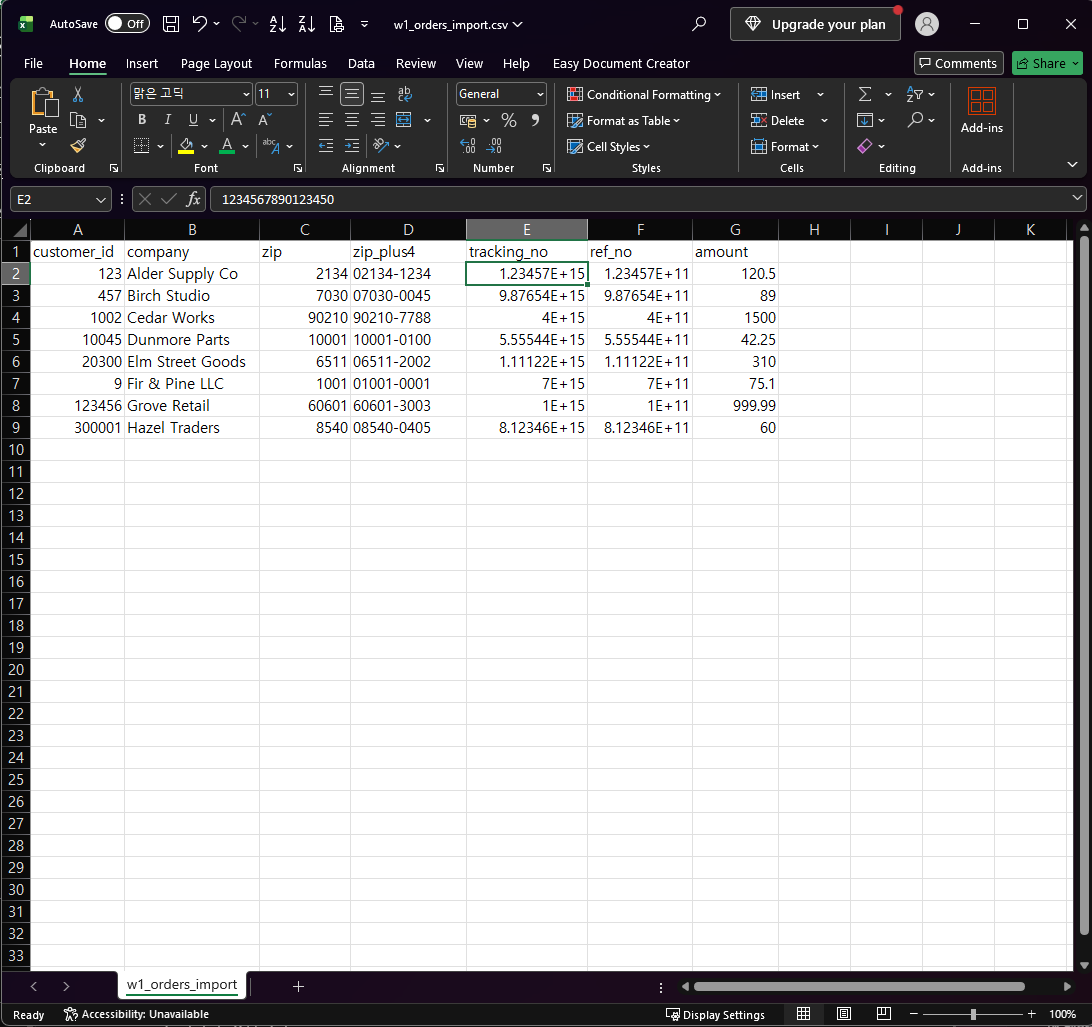
Opened by double-click: tracking_no and ref_no appear in scientific notation, and the formula bar for E2 already ends in 0.
In our test, tracking_no appeared as 1.23457E+15 and ref_no as 1.23457E+11. Click cell E2 and look at the formula bar. The CSV contains 1234567890123456, but the formula bar shows 1234567890123450. The last digit has already changed from 6 to 0.
Two Different Problems: Display vs. Lost Digits
We selected both columns, applied the Number format with 0 decimal places, and widened the columns.
After applying Number format, ref_no shows all 12 digits, but tracking_no still ends in 0.
The two columns behaved differently:
Column
In the CSV
In Excel after Number format
What it means
ref_no (12 digits)
123456789012
123456789012
Display problem only. The value was kept.
tracking_no (16 digits)
1234567890123456
1234567890123450
The stored value changed.
Across all 8 rows of our test file, the 12-digit ref_no values matched the CSV exactly once we applied the number format, and the 16-digit tracking_no values had their last digit replaced with 0 in all 8 rows. (We checked the formula bar only for E2, so the other rows are based on the values shown in the cells.)
This matches what Microsoft documents: Excel keeps a maximum of 15 significant digits, and for numbers with 16 or more digits, the digits after the 15th become zeros. A 12-digit number is within that limit, so Excel kept it. Changing the number format afterward did not bring the last digit of tracking_no back, and Microsoft says the same about formats applied after the fact. We tested only the Number format.
The Safest Method: Import With Data > From Text/CSV
Do not double-click the CSV. Open a new blank workbook in Excel instead.
Go to the Data tab, click From Text/CSV, select your file, and click Import.
In the preview window, click Transform Data. This opens the Power Query Editor.
In the Applied Steps pane on the right, find the Changed Type step that Excel added automatically. In our test it had set tracking_no and ref_no to whole numbers (the 123 icon in the column header), and the values already appeared as 1.23457E+15 and 1.23457E+11. We deleted this step before setting Text. Click the X next to Changed Type to delete it.
The automatic Changed Type step has already set tracking_no and ref_no to whole numbers, shown here as 1.23457E+15 and 1.23457E+11.
Click the data type icon at the left of the tracking_no column header and choose Text. Repeat for ref_no. Both columns should show the ABC icon and the full values, such as 1234567890123456 and 123456789012.
tracking_no and ref_no set to Text in the Power Query Editor, with all digits visible.
On the Home tab, click Close & Load.
Select E2 in the new worksheet. The formula bar should show 1234567890123456.
After Close & Load, tracking_no keeps all 16 digits and ref_no keeps all 12.
In our test, all 8 tracking_no values and all 8 ref_no values matched the original CSV. Keep identifiers such as tracking numbers, account numbers, and card-style codes as Text. If you ever need to calculate with a column, convert it to numbers first. Be aware that a number with more than 15 digits would lose digits at that point, so do not convert identifiers like these.
If You Already Opened the CSV the Usual Way
Once Excel has converted a 16-digit number, the cell no longer contains the original last digit. The formula bar in the first screenshot shows 1234567890123450, and reformatting the cell does not change it. Microsoft’s guidance is to use the Text format for codes with 16 or more digits.
Go back to the original file:
Close the workbook without saving.
Re-import the original CSV with the steps in the previous section.
In our test we closed the double-clicked file without saving and the original CSV was unchanged. The cells hold the changed values, so anything you save from them cannot contain the lost digits. We did not test what happens when you save the workbook over the original, so keep the original file untouched. If you saved the converted data over the only copy of the CSV, check file history, backups, or the system that produced the file. Do not try to guess the missing digits from the worksheet.
A 12-digit number that only looks like 1.23457E+11 is different. Its value was kept, and the number format changes how it is displayed. If you still have the original CSV, importing it as Text is the cleaner path for both columns.
Which Version of Excel Do You Need?
Microsoft lists Excel for Microsoft 365, Excel 2024, Excel 2021, Excel 2019, and Excel 2016 as applying to the source pages below. This guide uses no new functions. We tested only one desktop Excel build (English interface, Korean-language Windows), so button names in other versions may differ slightly.
One-line Summary
Excel keeps only 15 significant digits, so do not double-click a CSV that contains 16-digit numbers. Import it with Data > From Text/CSV, click Transform Data, delete the automatic Changed Type step, set those columns to Text, and click Close & Load. If the digits are already zeroed out, re-import the original file.
Sources
Keeping leading zeros and large numbers — Microsoft Support. Backs the 15-significant-digit limit, the digits after the 15th becoming zeros, the advice to use Text for numbers with 16 or more digits, and that applying a format afterward does not change what was already entered.
Import or export text (.txt or .csv) files — Microsoft Support. Backs the Data > From Text/CSV path and the statement that opening a .csv directly applies Excel’s default format settings.
Note: the 1.23457E+15 and 1.23457E+11 displays, the 1234567890123450 formula bar value, the 8/8 and 8/8 row comparison, and the full values after Close & Load come from our own reproduction in the Excel desktop app, not from these pages.
You open a CSV in Excel and the ZIP code 02134 turns into 2134. The customer ID 000123 becomes 123. In our test CSV, the zeros remained in the source file. They disappeared when Excel converted those columns to numbers as it opened the file.
The safest fix is to import the file with Data > From Text/CSV and set those columns to Text before the data reaches the worksheet. This guide shows how to keep leading zeros in Excel when you import a CSV: the exact steps, what each screen should look like, and what to do if you have already opened the file the usual way.
Applies to: Microsoft documents the leading-zeros behavior and the From Text/CSV import for Excel for Microsoft 365, Excel 2024, Excel 2021, Excel 2019, and Excel 2016. Tested in the Excel desktop app with an English interface on Korean-language Windows. We did not test other Excel versions, so menu names may look slightly different there.
The screenshots use a small made-up CSV with a customer_id column (000123, 000457, 001002, and so on) and a zip column (02134, 07030, 90210, and so on).
Free practice workbook. Download the CSV Import Cleanup Pack (one .xlsx file, no email address or sign-up needed). The CSV files are not included as separate downloads: to practice, copy the text from the workbook’s 1a_orders_csv and 1b_dates_csv sheets into Notepad and save them as .csv files, following the 2_Practice sheet. We tested the workbook in Excel 2021 on Windows with an English interface and Korean regional settings; other versions, regional settings, Mac and Excel Online were not tested.
What Goes Wrong When You Double-Click a CSV
When you open a .csv file directly, Excel interprets each column using its default data format settings, which may not match what you need. Microsoft’s own example is a column of numbers with leading zeros that you want to keep as text. Microsoft also explains that Excel removes leading zeros so formulas and math operations can work on the values.
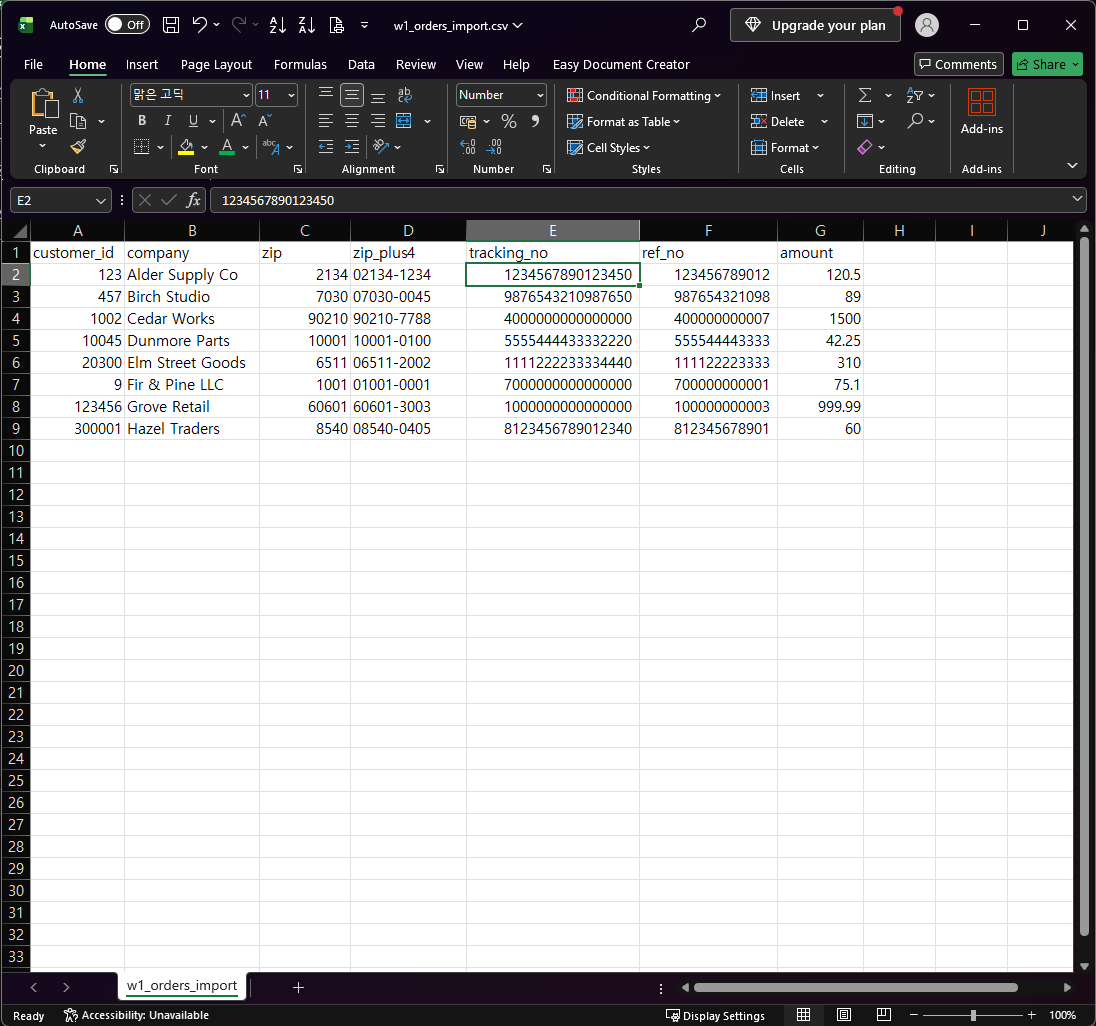
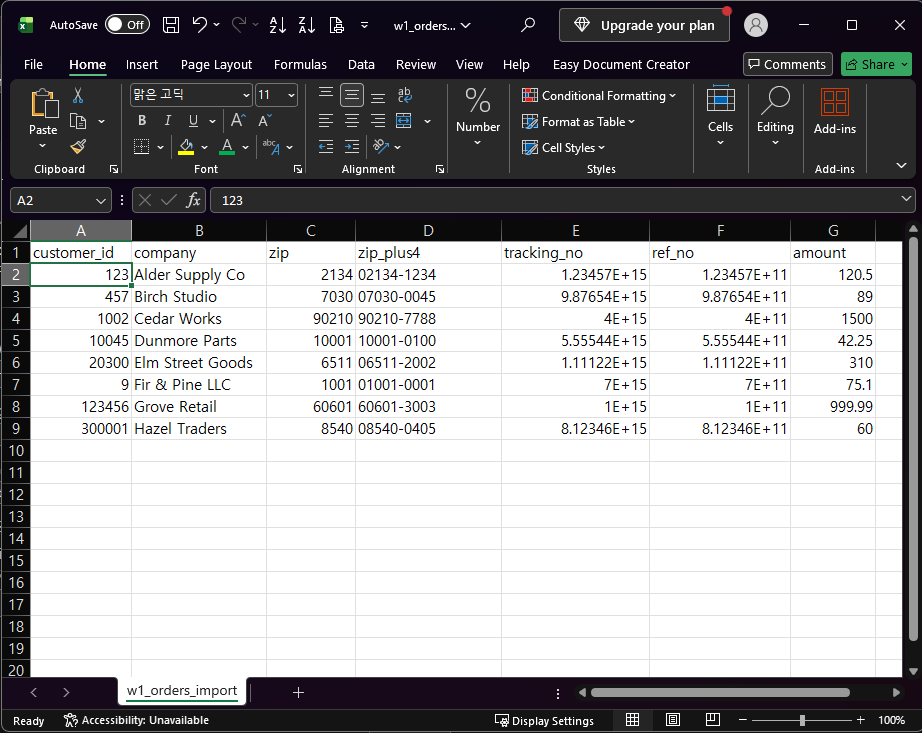
Opened by double-click: customer_id and zip have lost their leading zeros.
Click a cell such as A2 and look at the formula bar. It shows 123, not 000123, so the cell now contains the number 123. In our test the zip_plus4 column kept its zeros (02134-1234). Those values contain a hyphen, so Excel did not treat them as plain numbers.
The Safest Method: Import With Data > From Text/CSV
Do not double-click the CSV. Open a new blank workbook in Excel instead.
Go to the Data tab, click From Text/CSV, select your file, and click Import.
In the preview window, click Transform Data. This opens the Power Query Editor.
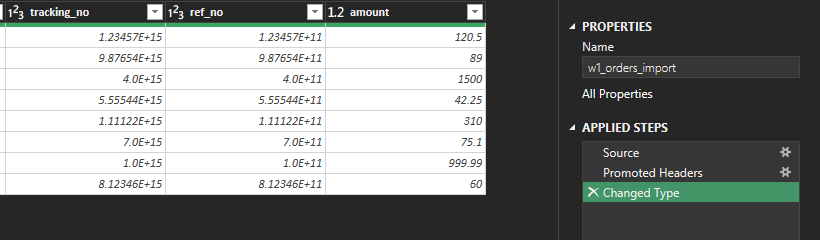
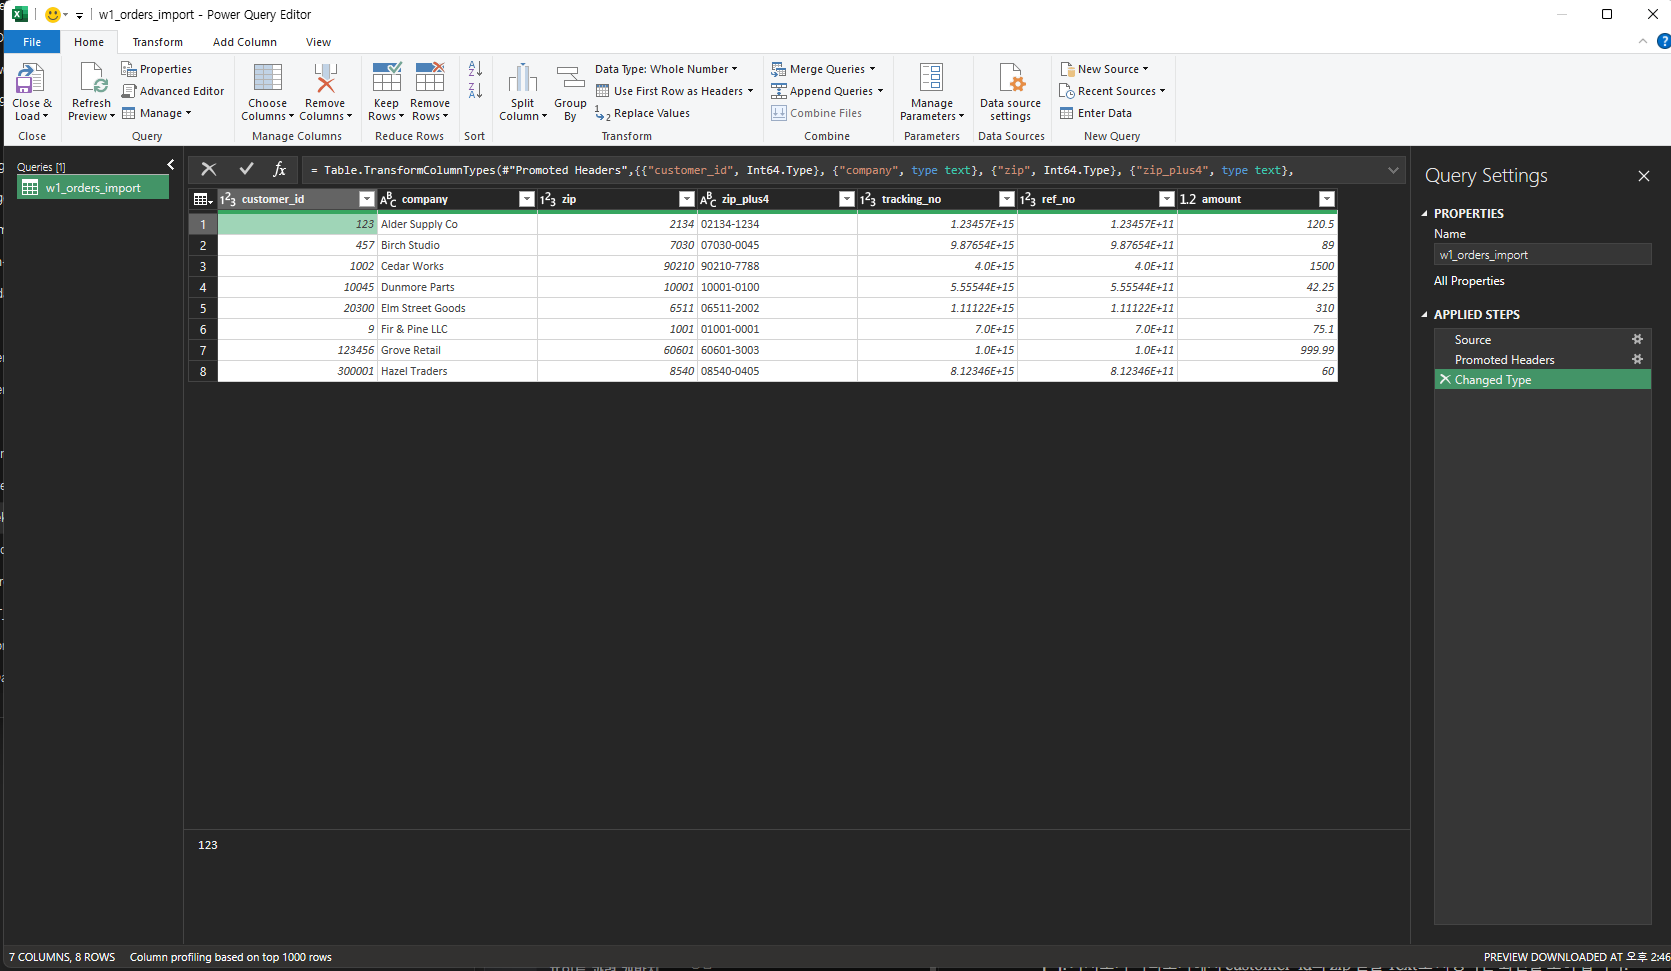
In the Applied Steps pane on the right, look for a step named Changed Type. Excel added it automatically, and in our test it set customer_id and zip to whole numbers (Int64), which is where the zeros were lost. Click the X next to Changed Type to delete it.
The automatic Changed Type step has already turned customer_id and zip into whole numbers.
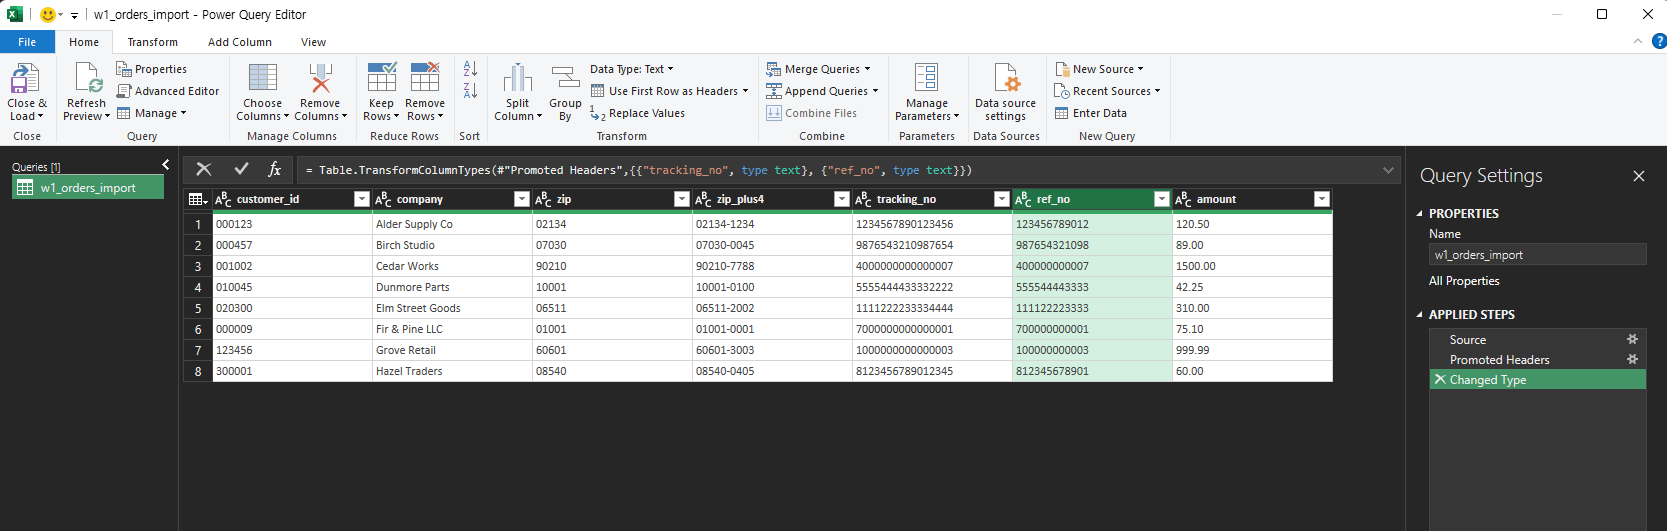
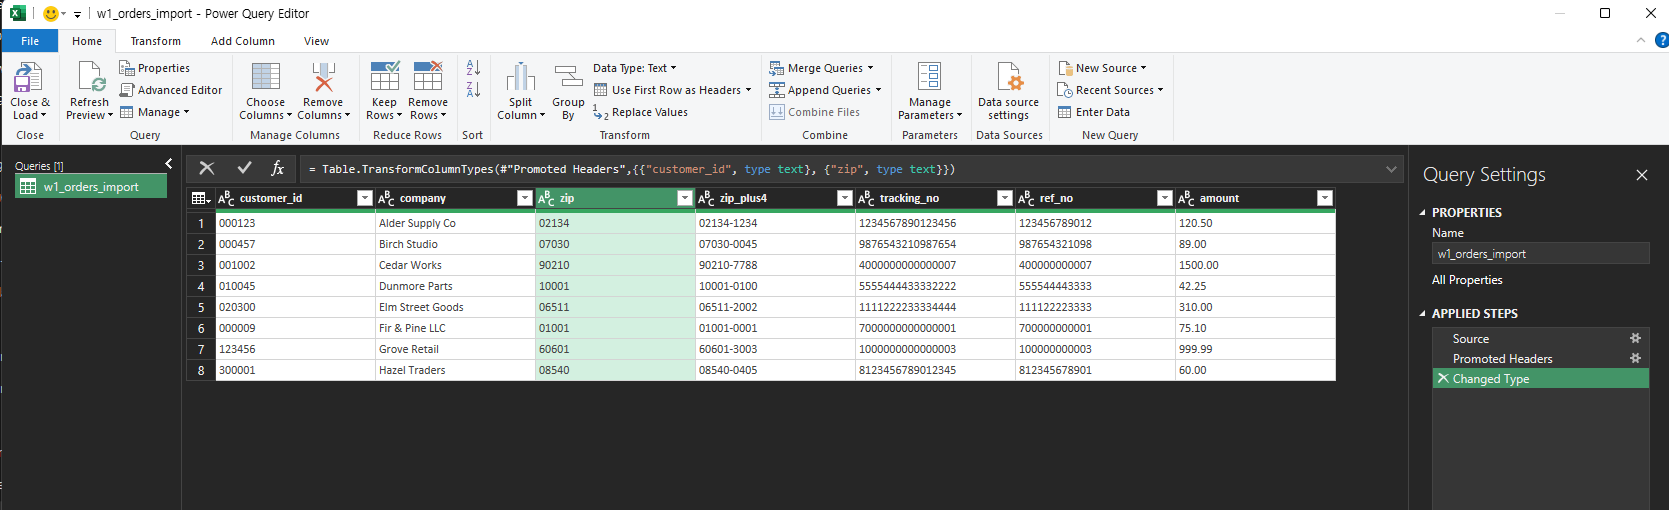
Click the data type icon at the left of the customer_id column header and choose Text. Repeat for zip. Both columns should now show the ABC icon and values such as 000123 and 02134.
customer_id and zip set to Text in the Power Query Editor.
On the Home tab, click Close & Load.
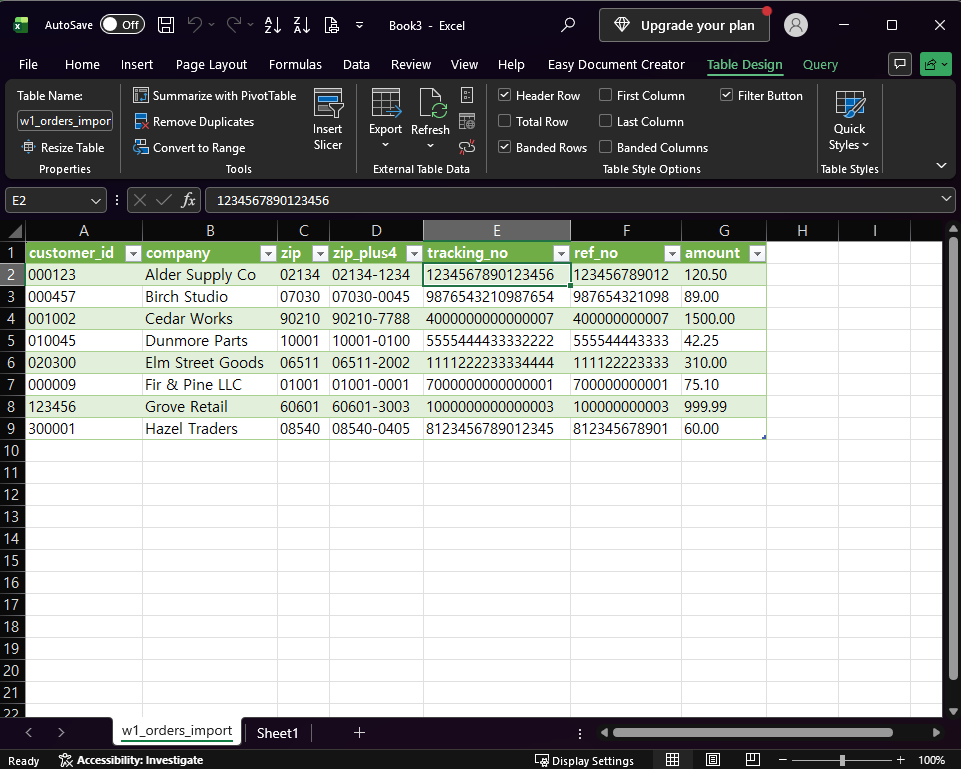
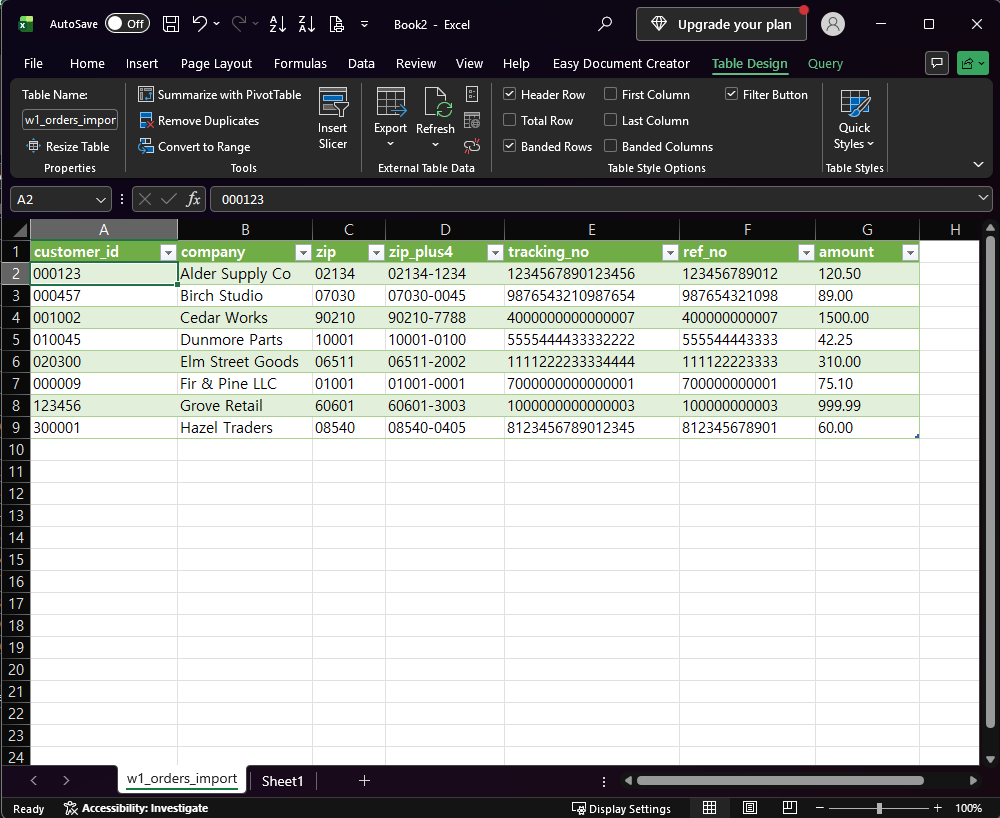
Check the result in the new worksheet. Select A2 and the formula bar should show 000123.
After Close & Load, the leading zeros are preserved.
Keep columns such as ZIP codes and IDs as Text. If you later need to calculate with a column, convert it to numbers first.
If You Already Opened the CSV the Usual Way
Once Excel has converted the cells to numbers, the zeros are no longer in the cell values. The formula bar in the first screenshot shows this: it holds 123. Microsoft notes that applying a number format does not bring back leading zeros that were already removed, so reformatting those cells is not a reliable recovery.
The fix is to go back to the original file:
Close the workbook without saving.
Re-import the original CSV with the steps in the previous section.
In our test we closed the double-clicked file without saving, and the original CSV was unchanged. We opened the same file in Notepad and it still contained 000123 and 02134. We did not test what happens if you save the workbook over the original, so keep the original file untouched. If you saved the converted data over the only copy of the CSV, check file history, backups, or the system that produced the file. Excel cannot reconstruct the original leading zeros from the converted numeric cells alone.
Typing Values Directly Into Cells
This guide covers data that arrives in a CSV. If you type ZIP codes or IDs yourself, Microsoft’s guidance is to format the cells as Text before you enter the values, or to type an apostrophe before the number. We did not test those methods here.
Which Version of Excel Do You Need?
Microsoft lists Excel for Microsoft 365, Excel 2024, Excel 2021, Excel 2019, and Excel 2016 as applying to both source pages below. This guide uses no new functions. We tested only one desktop Excel build (English interface, Korean-language Windows), so button names in other versions may differ slightly.
One-line Summary
Do not double-click a CSV that contains ZIP codes or ID numbers. Import it with Data > From Text/CSV, delete the automatic Changed Type step, set those columns to Text, and click Close & Load. If you have already opened the file, close it without saving and import it again.
Sources
Keeping leading zeros and large numbers — Microsoft Support. Backs the statements that Excel removes leading zeros so formulas and math operations can work, that formatting does not restore zeros removed earlier, and the Text-format and apostrophe options for typed values. It also describes converting columns to Text in the Power Query Editor and using Close & Load.
Import or export text (.txt or .csv) files — Microsoft Support. Backs the Data > From Text/CSV path and the statement that opening a .csv directly applies Excel’s default format settings, with a column of numbers that contains leading zeros as the example.
Note: the automatic Changed Type step setting customer_id and zip to Int64, the 123 value in the formula bar, and the 000123 result after Close & Load come from our own reproduction in the Excel desktop app, not from these pages.
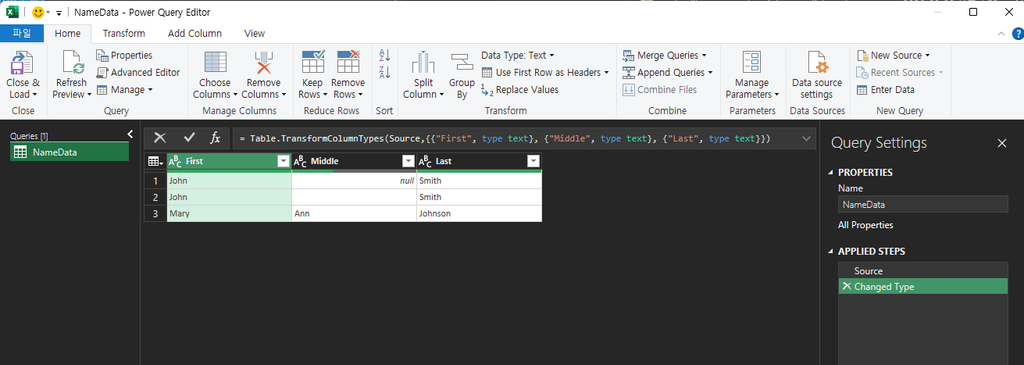
A column that appears empty at a glance in Power Query can hold either null or "" (an empty string). In this project’s observed preview, null appeared in italics while an empty string appeared as a plain blank cell. Functions like Text.Combine treat the two differently, and mixing them up silently produces wrong results — not an error.
Applies to: Power Query / Get & Transform in all current Excel versions (Excel for Microsoft 365, Excel 2024, Excel 2021, Excel 2019, Excel 2016) and Power BI, since the M language and its functions behave the same way across these hosts.
The Problem: A Middle Name Column
Take a simple “combine three name columns into one” task — First, Middle, Last — joined with Text.Combine and a space separator:
Text.Combine({[First], [Middle], [Last]}, " ")
For most rows this works exactly as expected. But this project directly reproduced a case where two rows that both “look” like they have no middle name produce different results:
A row where Middle is null: Text.Combine skips it entirely. Result: “John Smith” (one space between the names, as expected).
A row where Middle is "" (empty string, not null): Text.Combine does not skip it — it still inserts a separator on each side of the empty value. Result: “Jane Doe” — two spaces between “Jane” and “Doe”, not one.
This is exactly the kind of bug that passes a quick visual check and then breaks something downstream, like a text match or a fixed-width export — the extra space is easy to miss just by looking at the result, but it’s really there and will affect anything that compares the text exactly or counts characters.
Why This Happens
Text.Combine joins a list of text values into one, and it treats null as “no value to contribute” — it does not add a separator for a null entry. An empty string, on the other hand, is a real value (a zero-length piece of text), so Text.Combine treats it as a legitimate entry that still gets a separator placed around it, even though the value itself contributes nothing visible.
It’s worth noting that Excel’s own Go To Special > Blanks command draws a related but not identical distinction: it selects genuinely empty cells, not cells that merely display as blank because a formula returned “”. The underlying lesson is the same one this article is about — don’t assume “looks empty” means “is empty” — but Excel’s blank cell and Power Query’s null are not literally the same data type, and Go To Special’s cell-selection behavior isn’t run through the same code as Text.Combine. Treat the comparison as a useful reminder to check, not as proof that the two features work identically.
How to Tell Them Apart
In the Power Query editor, null values are displayed in italics; empty strings display as a blank cell without italics. This is a visual cue you can check directly in the data preview — it’s easy to miss if you’re scanning quickly, but it’s there.
To check programmatically instead of relying on the visual difference, add flag columns with Table.AddColumn. As a full Advanced Editor step sequence, chained so each step references the previous one:
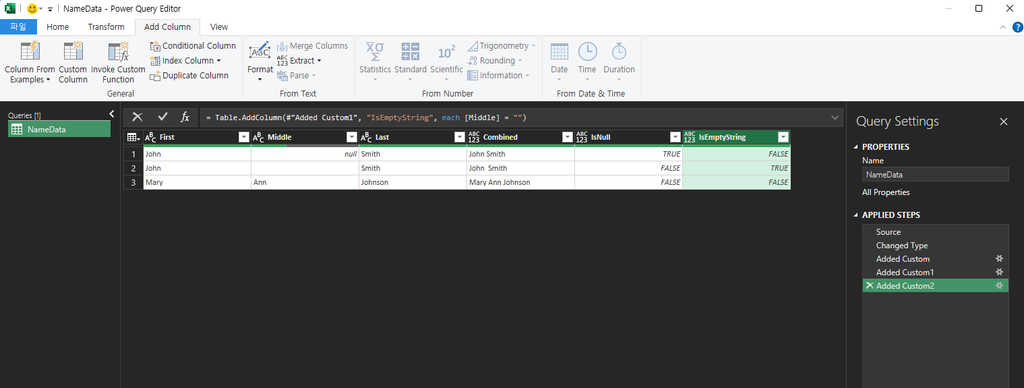
IsNull = Table.AddColumn(Source, "IsNull", each [Middle] = null, type logical),
IsEmptyString = Table.AddColumn(IsNull, "IsEmptyString", each [Middle] = "", type logical)
This adds a column that’s TRUE only for a genuine null, and a separate column that’s TRUE only for an empty string, so you can see row by row which rows actually have which value.
If you’re building this through the UI instead of the Advanced Editor, use Add Column > Custom Column twice — once per flag. In the Custom Column dialog, you don’t paste the Table.AddColumn(…) wrapper; you only enter the expression after each, i.e. [Middle] = null for the first column and [Middle] = "" for the second. Power Query generates the surrounding Table.AddColumn step for you.
How to Fix It
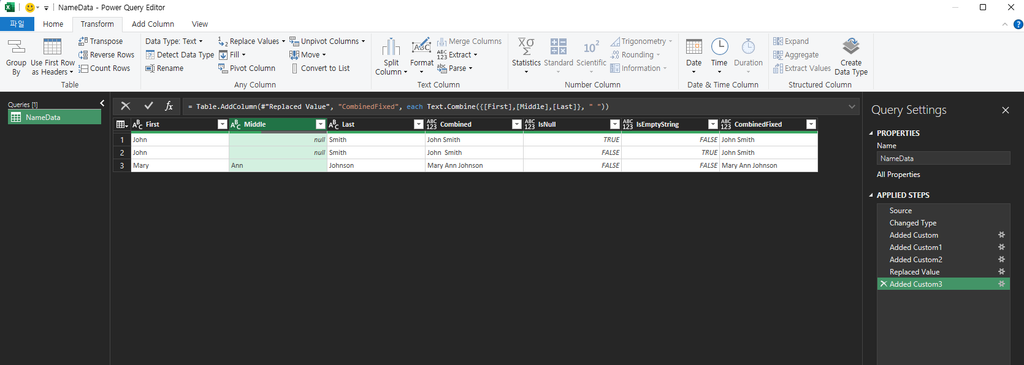
If you want both null and "" treated the same way (skipped, not contributing a stray separator), normalize one to the other before combining — for example, replace empty strings with null first:
After this step, every “no middle name” row is a genuine null, and Text.Combine will skip all of them consistently, regardless of whether the original data used null or “” to represent “nothing here.” For how null and empty-string keys behave when you remove duplicates, see our guide on Power Query Remove Duplicates.
One practical note from testing this: Power Query columns are computed once, at the step where they’re added, not live-recalculated. If you already have a Text.Combine step earlier in your query, adding Table.ReplaceValue after it will not retroactively fix that column’s existing output. Put the Table.ReplaceValue step before your Text.Combine step, or add a fresh Text.Combine column after the fix, to see the corrected result.
One-line Summary
Text.Combine skips null values but not empty strings (“”) — a null “no value” is invisible to it, while an empty string is a real, zero-length value that still gets a separator placed around it, producing an extra space that’s easy to miss on a visual check. Use Table.AddColumn with each [Column] = null / each [Column] = “” to check which rows actually have which value, and normalize “” to null with Table.ReplaceValue before combining if you need consistent behavior.
Sources
Text.Combine — Microsoft Learn (Power Query M reference). Backs the general syntax and purpose of Text.Combine (joining a list of text values with a separator).
The specific behavior difference — Text.Combine skipping null but not skipping “”, including the exact resulting text for both cases — was directly reproduced by this project in Power Query, including a dedicated fixture and 5 screenshots. This distinction is not explicitly spelled out in the Text.Combine reference page itself; it is project-verified behavior, not a direct quote from official documentation.
A single cell like Apple, Banana, Cherry sometimes needs to become three separate rows instead of three separate columns — for example, to make each value filterable, sortable, or usable in a pivot table. Excel has two ways to do this, and which one you can use depends on your Excel version.
Applies to: Excel for Microsoft 365 and Excel 2024 (TEXTSPLIT, native row-splitting); Excel 2021, 2019, and 2016 (Power Query fallback — TEXTSPLIT is not available).
TEXTSPLIT splits text using a delimiter you specify, and it can split into rows, not just columns, by passing the delimiter as the row_delimiter argument instead of the default col_delimiter:
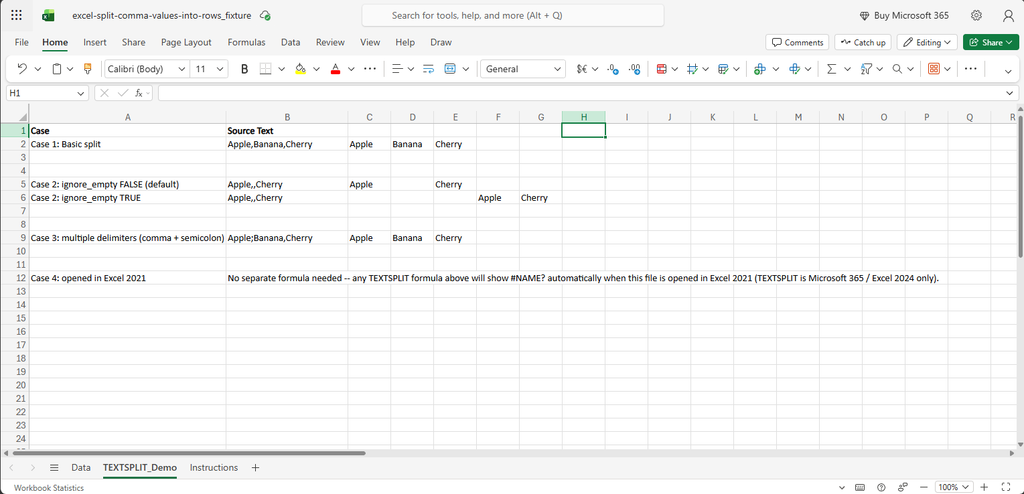
=TEXTSPLIT(A2, , ",")
This splits the text in A2 on commas and spills the results downward into separate rows starting at the formula’s cell (the blank argument skips col_delimiter so only row_delimiter is used).
Microsoft documents three behaviors of TEXTSPLIT that matter for this task:
row_delimiter: the argument that controls splitting into rows, as used above.
ignore_empty: when set to TRUE, consecutive delimiters (for example, Apple,,Cherry) do not produce a blank row between values. The default is FALSE, which does produce blank entries for empty splits.
Multiple delimiters: row_delimiter accepts an array of delimiters (for example, {“,”, “;”}), so a column mixing comma- and semicolon-separated values can be split with one formula.
Because the formula spills, do not type anything into the cells below it — TEXTSPLIT needs that space to place the split results, and existing content there will cause a #SPILL! error.
Why TEXTSPLIT Might Not Work For You
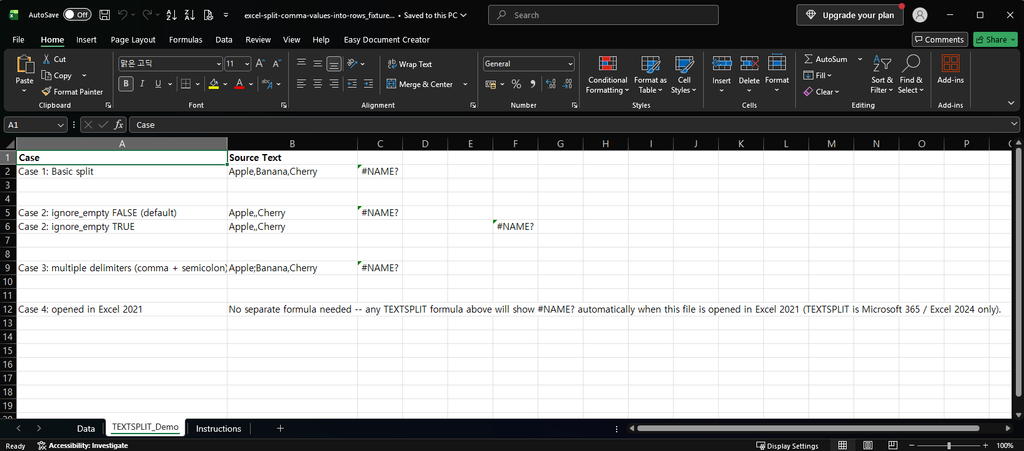
TEXTSPLIT is a newer dynamic-array function. This project directly reproduced the following in Excel 2021: entering a TEXTSPLIT formula returns #NAME? — Excel 2021 does not recognize the function name at all, across every delimiter/blank/multiple-delimiter case tested. This matches Microsoft’s own version scoping for the function, which lists Microsoft 365 and Excel 2024 as the supported versions.
If you see #NAME? after typing a TEXTSPLIT formula, that is very likely the cause — not a typo in the formula. Another function that returned #NAME? in our Excel 2021 is TEXTBEFORE; see our guide on extracting text before or after a character.
Method 2: Power Query (Excel 2021, 2019, 2016)
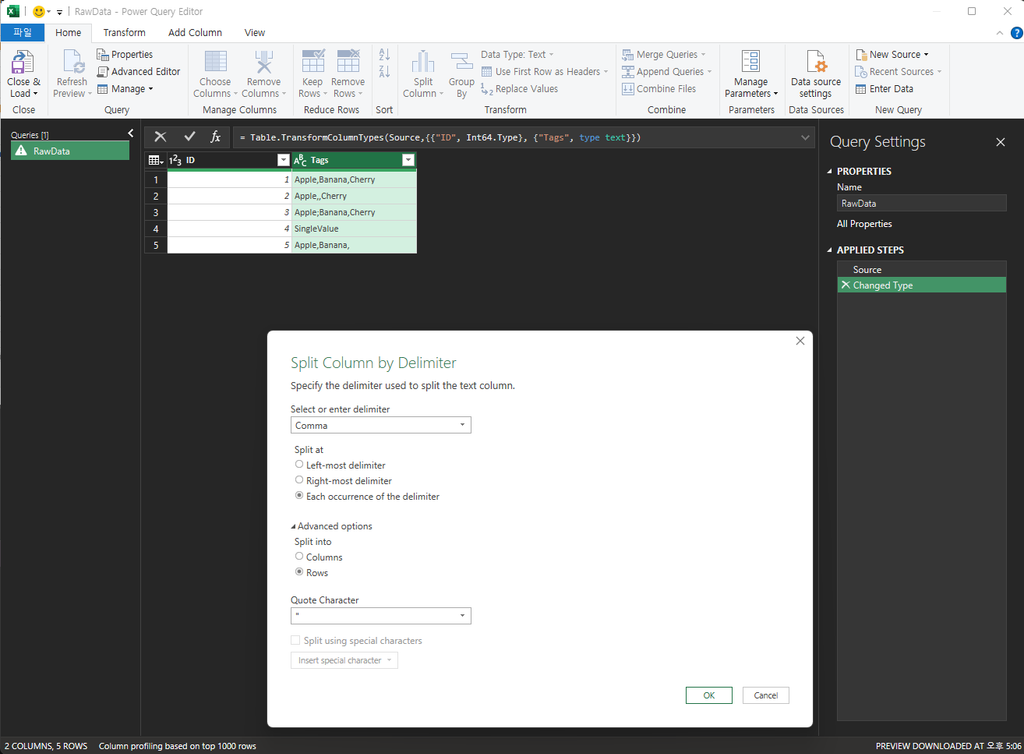
Power Query’s Split Column by Delimiter, using the Rows option instead of the default Columns option, does the same job on older Excel versions:
Select the column you want to split.
Go to Data > Get & Transform > From Table/Range (or open the query in Power Query Editor if the data is already a query).
Right-click the column, choose Split Column > By Delimiter.
Choose your delimiter (Comma, Semicolon, or Custom).
Under Split into, choose Rows instead of the default Columns.
Click OK, then Close & Load.
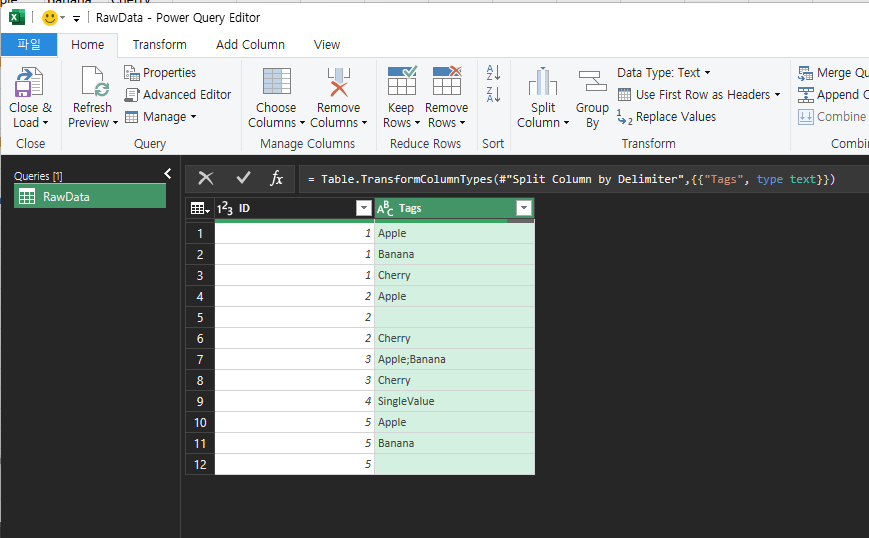
The Split Column by Delimiter dialog takes a single delimiter per step (Comma, Semicolon, or one Custom value you type in) — it does not have TEXTSPLIT’s array-of-delimiters argument for mixing delimiter types in one pass. This project confirmed the result directly: splitting a column that mixes delimiters (for example Apple;Banana,Cherry) by comma only splits on the comma — the semicolon-joined portion (Apple;Banana) stays together as a single value. To fully split mixed-delimiter data, run the Split Column step again on the result (once per delimiter type), or normalize all delimiters to one character first (for example with a Find & Replace step) before splitting.
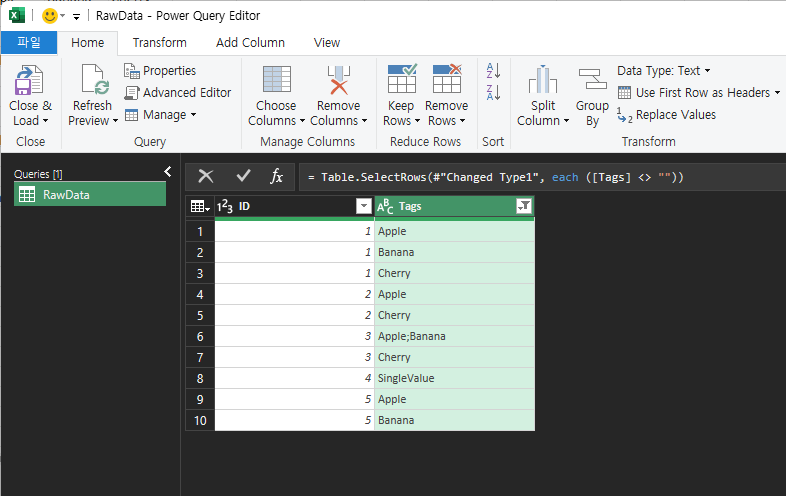
This project confirmed how the split-into-rows step behaves on consecutive delimiters (for example, Apple,,Cherry): unlike TEXTSPLIT’s ignore_empty argument, Power Query has no built-in option to skip blank results — splitting produces a literal blank row wherever two delimiters are adjacent (or a delimiter is at the start/end of the text). To remove them, filter the split column afterward: click the column’s filter arrow and uncheck (blank), or use Home > Remove Rows > Remove Blank Rows.
Which Method Should You Use?
TEXTSPLIT
Power Query
Excel version
Microsoft 365, Excel 2024 only
2016, 2019, 2021, 2024, Microsoft 365 (all versions)
Result type
Formula (recalculates automatically when source cell changes)
Query (needs “Refresh” to pick up source changes)
Skips blank splits
Yes, via ignore_empty argument
No built-in option — produces a blank row; filter it out afterward
Multiple delimiters
Yes, via a delimiter array
No — one delimiter per step; run the split again per delimiter type, or normalize first
If you’re on Microsoft 365 or Excel 2024, TEXTSPLIT is simpler for a one-off, self-updating formula. If you’re on an older version, or you’re already building a Power Query pipeline for other cleanup steps, the Power Query method keeps everything in one place and doesn’t depend on a specific Excel version.
One-line Summary
Use TEXTSPLIT(cell, , delimiter) to split values into rows on Microsoft 365 or Excel 2024. On Excel 2021, 2019, or 2016 — where TEXTSPLIT returns #NAME? — use Power Query’s Split Column > By Delimiter, choosing Rows instead of Columns. Power Query produces a blank row for consecutive delimiters (filter it out afterward) and splits on only one delimiter per step (run it again per delimiter type for mixed data) — both confirmed by this project’s own reproduction, not just documentation.
Sources
TEXTSPLIT function — Microsoft Support. Backs the row_delimiter, ignore_empty, and multiple-delimiter-array behavior described in Method 1, and the Microsoft 365 / Excel 2024 version scoping.
Split a column of text (Power Query) — Microsoft Support. Backs the Split Column by Delimiter steps in Method 2, including the Rows-vs-Columns choice.
The specific finding that TEXTSPLIT returns #NAME? in Excel 2021 was independently reproduced by this project in real Excel 2021 across all tested delimiter/blank/multiple-delimiter cases. Power Query’s blank-row and multi-delimiter behavior for the Split Column by Delimiter step was also independently reproduced by this project (fixture and screenshots): splitting produces a literal blank row for consecutive delimiters with no built-in skip option, and splits on only the one delimiter chosen per step.
Excel’s built-in Data > Remove Duplicates command always keeps the first row it encounters for each duplicate key and deletes the rest. That’s fine when “first” is the row you actually want to keep. It’s a problem when you need the latest record per customer, an ID column with occasional blanks, or a tie between two rows updated on the same day.
Power Query handles all of these, but it needs to be told explicitly which row to keep — it does not have a single “remove duplicates, keep the newest” button. This guide builds that logic step by step, covering the edge cases that break a naive approach.
Applies to: Excel for Microsoft 365, Excel 2024, Excel 2021, Excel 2019, and Excel 2016 (Power Query / Get & Transform is available in all of these).
Why Not Just Use Remove Duplicates?
Microsoft documents that Excel’s Remove Duplicates command keeps the first occurrence of a duplicate and deletes the rest of the rows that match on the columns you selected as the comparison key. There is no option to control which occurrence survives — it’s always the first one in sheet order.
If your data isn’t already sorted so that the row you want is first, Remove Duplicates will keep the wrong row. And once it deletes a row, that’s it — there’s no audit trail showing what was removed or why.
Power Query solves both problems: you can define exactly which row should win, and the query itself documents the logic (it’s a repeatable set of steps, not a one-time deletion). If you only need to find duplicate or missing items without deleting anything, see our guide on comparing two lists in Excel.
The Building Block: Group and Pick One Row
The core pattern used throughout this guide is group by the key, then pick one row per group using Table.Group with a custom aggregation:
Table.Group(Source, {"CustomerID"},
  {{"Chosen", each Table.First(Table.Sort(_, {{"SortColumn", Order.Descending}})), type record}}
)
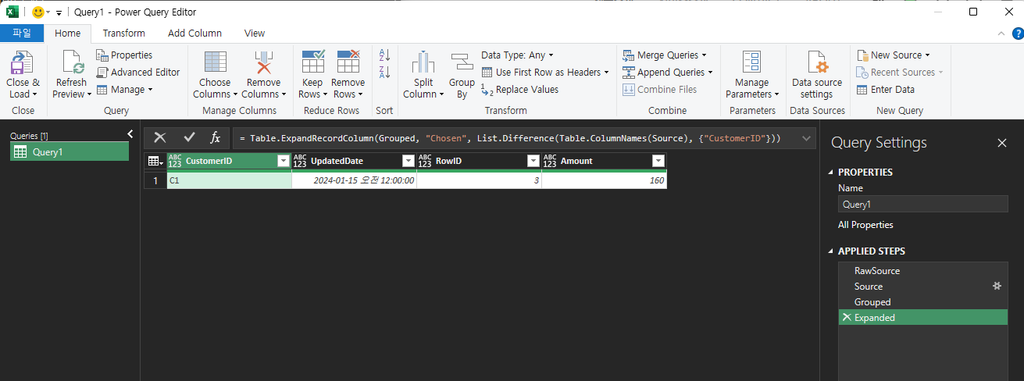
Read this as: “group all rows by CustomerID; within each group, sort by SortColumn descending, and keep only the first row of that sorted group.” Change what you sort by, and you change which row survives.
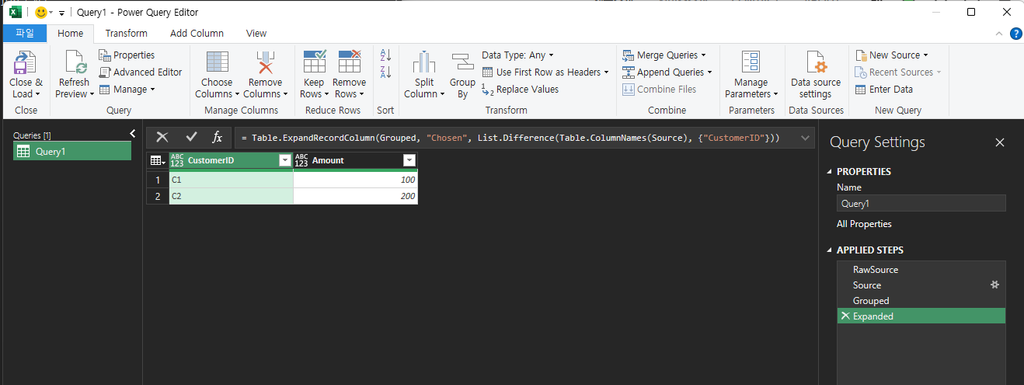
Table.Group with this aggregation produces a table with one column per grouping key plus a Chosen column holding a record (the whole winning row, packaged as one value) — not yet a normal flat table. Every case below needs one more step to turn that back into real columns:
GroupedResult already has a CustomerID column (the grouping key), and the Chosen record also contains a CustomerID field (it’s the whole original row). Expanding all of Chosen‘s fields — including CustomerID again — would try to create a second CustomerID column and fail. List.Difference removes the key column(s) from the list of fields to expand, so only the non-key fields come out of Chosen, and the existing CustomerID column from the grouping step is kept as-is.
Each case in this guide produces a grouped-and-sorted table exactly like GroupedResult above; add this expand step as the final step in every case to get the actual result table. For Case 3, which groups on a composite key, replace the last argument with List.Difference(Table.ColumnNames(Source), {"CustomerID", "OrderDate"}) instead.
Case 1: Basic Duplicate Key
If you just need one row per CustomerID and don’t care which one, group by the key and take the first row of each group as-is (no sort needed, or sort by whatever column reflects your preferred tie-break):
Table.Group(Source, {"CustomerID"}, {{"Chosen", each Table.First(_), type record}})
This is the Power Query equivalent of Remove Duplicates on a single column — except you can see and modify the logic later. If you only need a list of the distinct values, and your Excel does not have UNIQUE(), see our guide on getting unique values in Excel 2019 and 2016.
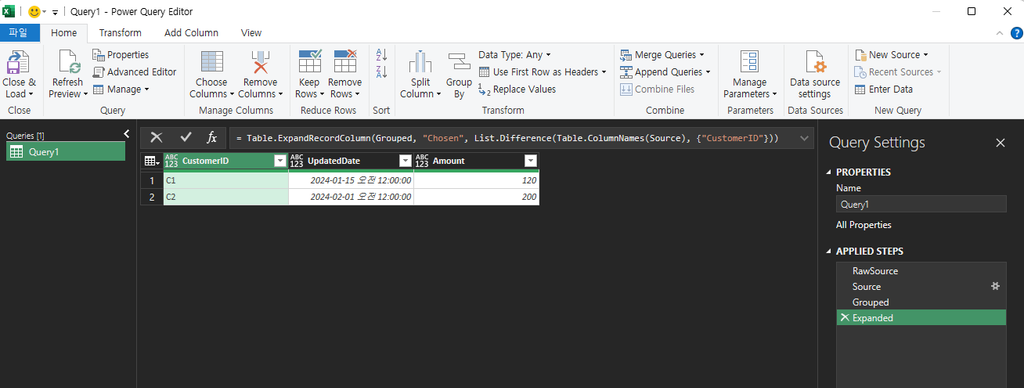
Case 2: Keep the Latest Row Per ID
To keep the most recently updated record per customer, sort by the date column descending before taking the first row of each group:
Table.Group(Source, {"CustomerID"},
  {{"Chosen", each Table.First(Table.Sort(_, {{"UpdatedDate", Order.Descending}})), type record}}
)
This is the pattern Remove Duplicates cannot express — it has no concept of “sort within each duplicate group first.”
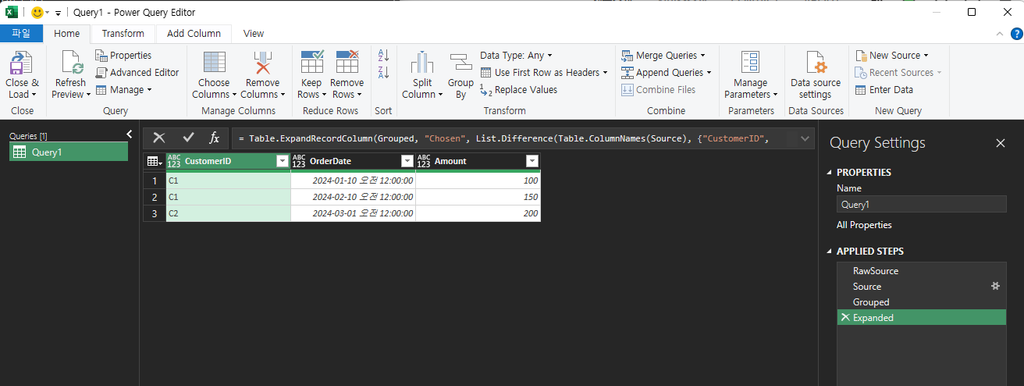
Case 3: Two-Column (Composite) Key
Some data doesn’t have a single unique identifier — a duplicate is only a duplicate if two columns match together (for example, CustomerIDandOrderDate). Group on both columns by passing a list of column names:
Table.Group(Source, {"CustomerID", "OrderDate"},
  {{"Chosen", each Table.First(_), type record}}
)
Grouping on the wrong single column here (just CustomerID, for instance) would collapse legitimately different orders from the same customer into one row — a correctness bug, not a cleanup.
Case 4: Blank or Null Keys
Rows with a blank or null key deserve a deliberate decision, not an accident. Table.Group treats null as its own group value — every row with a null key gets grouped together and only one of them survives, which silently deletes the others if you’re not expecting it.
Before grouping, decide explicitly:
Decide whether null and "" (empty string) both count as “missing” for this key. They are not the same value — Table.Group treats null as its own group and an empty-string key as a different group from null — so a filter written as <> null will still group every "" key together and silently keep only one of those rows. If both should be treated as missing, filter both explicitly: Table.SelectRows(Source, each [CustomerID] <> null and [CustomerID] <> "").
If blank-key rows are genuinely bad data, filter them out first (using the null-and-"" check above, as appropriate to your data) and handle them separately.
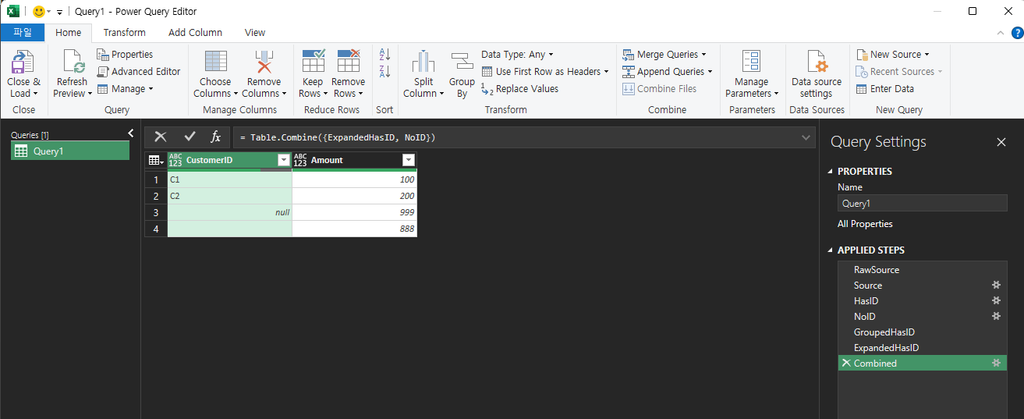
If blank-key rows are all real, distinct records that happen to be missing an ID, do not group them with the rest — route them around the deduplication step entirely (for example, split the table into “has ID” and “no ID” with Table.SelectRows on the negated condition, deduplicate only the “has ID” side, then combine the results back with Table.Combine).
The mistake this case guards against is exactly the same shape as the null-vs-empty-string distinction documented elsewhere for this project: Power Query does not treat every “missing” value the same way depending on how it got there, so blank keys need an explicit rule — one that names both null and "" — instead of being left to fall through the default grouping behavior.
Sorting by date breaks most duplicates, but two rows can share the exact same date. Sorting by date alone leaves the outcome ambiguous — Power Query will pick a row, but which one depends on the stability of the sort, not a rule you chose.
Add a second, deterministic sort key as a tiebreaker. Starting from the UpdatedDate column already used in Case 2, sort by date descending first, and add a row identifier as the second sort key to decide any tie:
Table.Group(Source, {"CustomerID"},
  {{"Chosen", each Table.First(Table.Sort(_, {
      {"UpdatedDate", Order.Descending},
      {"RowID", Order.Descending}
    })), type record}}
)
When two rows tie on UpdatedDate, the second sort key (RowID descending) decides the winner. Whatever you choose as the tiebreaker — a row ID, an import timestamp, a secondary sequence number — the important part is that it’s a column that is never itself tied, so the result is reproducible every time you refresh the query.
This pattern assumes every row has a real date. The next case (null dates) shows what to do when that’s not true, and how the tie-break code above needs to change once you’ve handled it.
Case 6: Null Dates
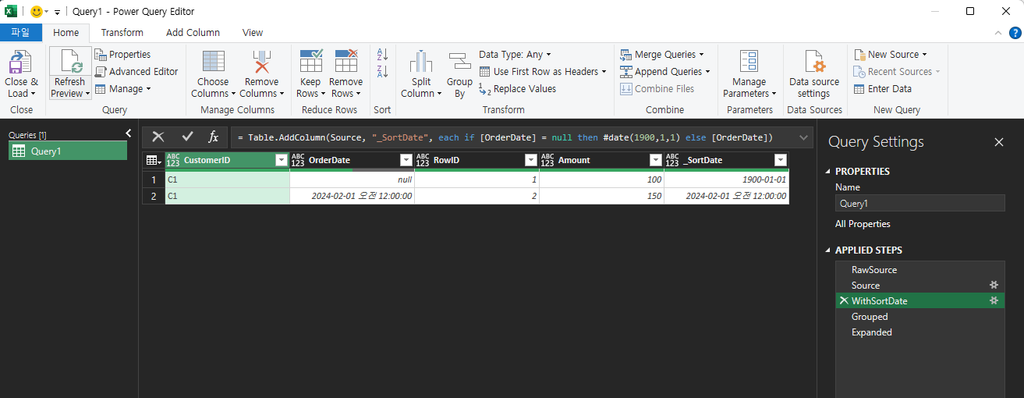
A null date can’t be compared or sorted the normal way, and it will otherwise sort inconsistently against real dates. This project’s reproduction handled it by substituting a fixed, clearly-out-of-range placeholder date for null before sorting — for example, replacing null with 1900-01-01 in a helper column (here called _SortDate) so every row has a real, sortable value:
_SortDate = if [OrderDate] = null then #date(1900,1,1) else [OrderDate]
This guarantees rows with a genuinely missing date always sort as the oldest record for that customer (so a row with real data wins the “keep latest” comparison), rather than causing an error or an unpredictable sort position.
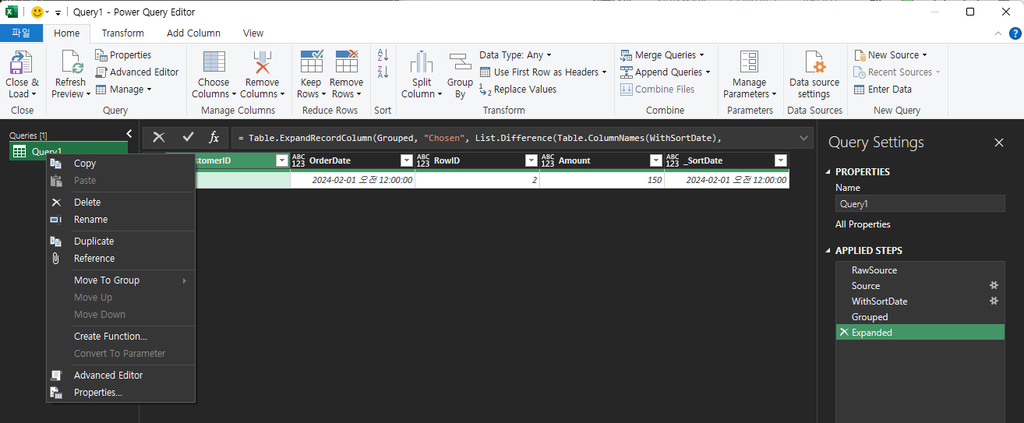
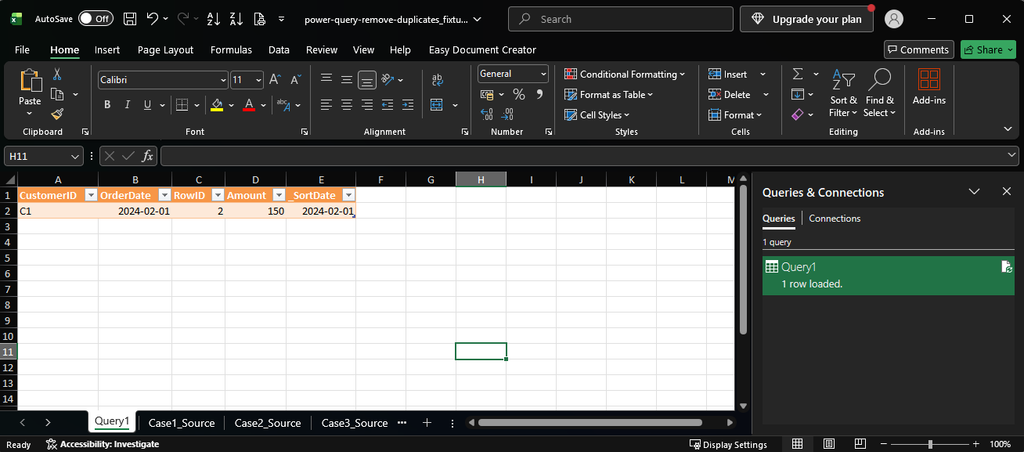
Combining this with Case 5’s tie-break: once you have the _SortDate helper column, use it in place of UpdatedDate in the Case 5 pattern, so the tie-break is safe against both same-date ties and null dates at once. This project’s own live-test reproduction confirmed the following combined pattern actually executes and resolves ties predictably:
Table.Group(WithSortDate, {"CustomerID"},
  {{"Chosen", each Table.First(Table.Sort(_, {
      {"_SortDate", Order.Descending},
      {"RowID", Order.Descending}
    })), type record}}
)
WithSortDate here is the table after the _SortDate helper column from this case has been added (for example, via Table.AddColumn(Source, "_SortDate", each if [OrderDate] = null then #date(1900,1,1) else [OrderDate])). This is the version to use in practice whenever your data can have both same-date ties and null dates, which is the common case.
Case 7: Query Folding
Query folding is Power Query’s ability to push transformation steps back to the data source (a SQL database, for example) instead of running them locally. It matters here because if a step folds, you’re trusting the source system’s engine to execute your logic instead of Power Query’s own engine — and not every source folds every step the same way.
For data that starts inside the workbook itself (Excel.CurrentWorkbook()), query folding does not apply — an in-workbook table is not a foldable source, so this concern is not applicable for the fixture and workflow described in this article. If your source is a database instead of a workbook table, check whether your grouping and sorting steps still fold as expected before relying on this pattern at scale, since Microsoft documents that Table.Distinct in particular does not generally guarantee which duplicate row survives once folding and query-plan optimization are involved.
Case 8: Making the Result Deterministic
Pulling the cases above together, “deterministic” here means: given the same input data, the query produces the exact same output every time it’s refreshed — no dependence on the order rows happen to appear in the source, and no silent tie-breaking left to chance.
That requires, in order:
A defined key (single column or composite — Cases 1 and 3).
A defined primary sort for “which row wins” (Case 2).
A defined, never-tied secondary sort for ties (Case 5).
A defined substitution for values that can’t sort normally, like null dates (Case 6).
An explicit decision for rows with a blank/null key, made before grouping rather than left to fall through it (Case 4).
Skip any one of these and the query can still run — it just won’t be guaranteed to give you the same answer twice.
One-line Summary
Excel’s Remove Duplicates always keeps the first row and gives you no control over which one that is. Power Query’s Table.Group + Table.Sort + Table.First pattern lets you define exactly which row wins — by recency, by a composite key, and with an explicit, never-tied tiebreaker for same-date rows — as long as you also decide up front what happens to blank keys and null dates instead of leaving them to the default behavior.